
On 21 October 2026 (US time), Meta, the spender the market feared most on AI cash, came in better than feared: its free cash flow was minus US$2.12bn against an analysts' estimate of about minus US$8.5bn, because it spent less than expected. I think the AI mood had already begun to turn, and this result supports it: it is not 2000, yet.
The biggest worry
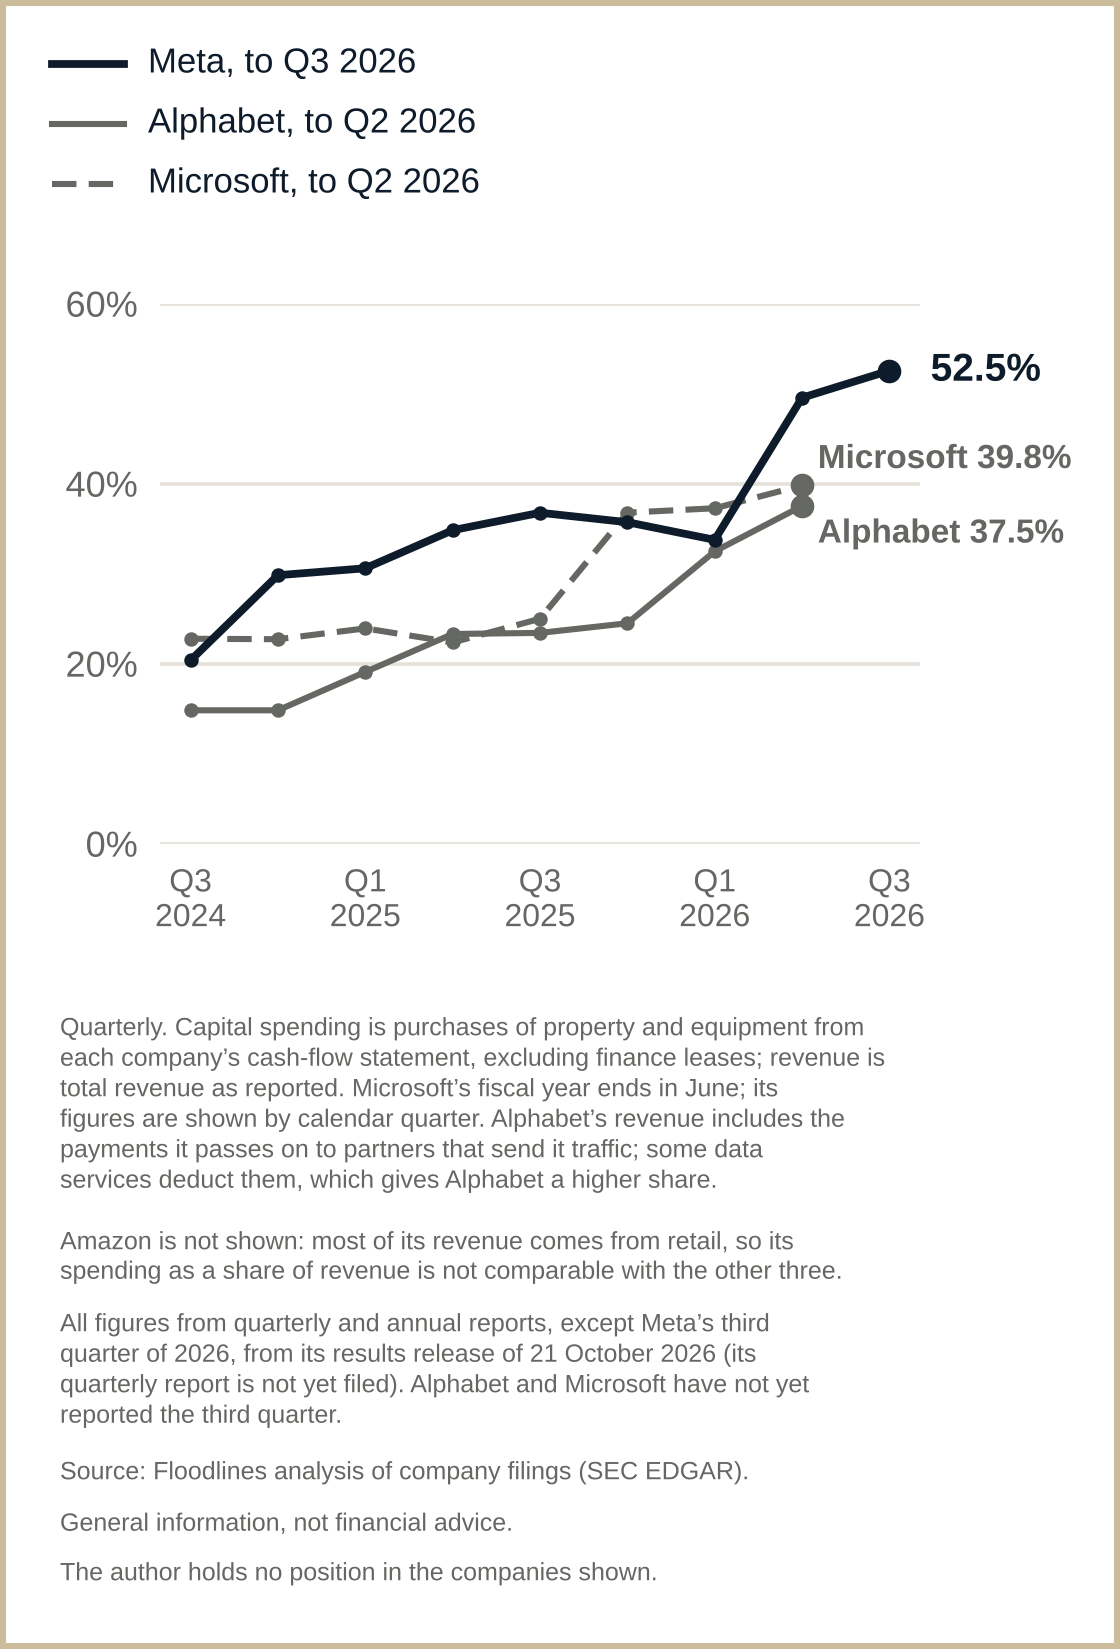
Meta, the first of the four biggest cloud spenders to report, was the market's biggest worry on AI cash. The pre-results headlines were about reports that it plans to issue new non-voting shares to raise capital (24/7 Wall St, 20 October), and it spends the most for its size: its capital spending (data centres and equipment) was 52.5% of its third-quarter revenue, against 39.8% at Microsoft and 37.5% at Alphabet in the second quarter. If the biggest worry beats the fear, do the other three follow?
Capital spending as a share of revenue, quarterly; Amazon is left out because most of its revenue is retail.
Did Meta pay for its AI spending from its own cash?
The test has started: Meta's revenue rose 26%, to US$64.6bn, a shot of adrenaline for the market's mood.
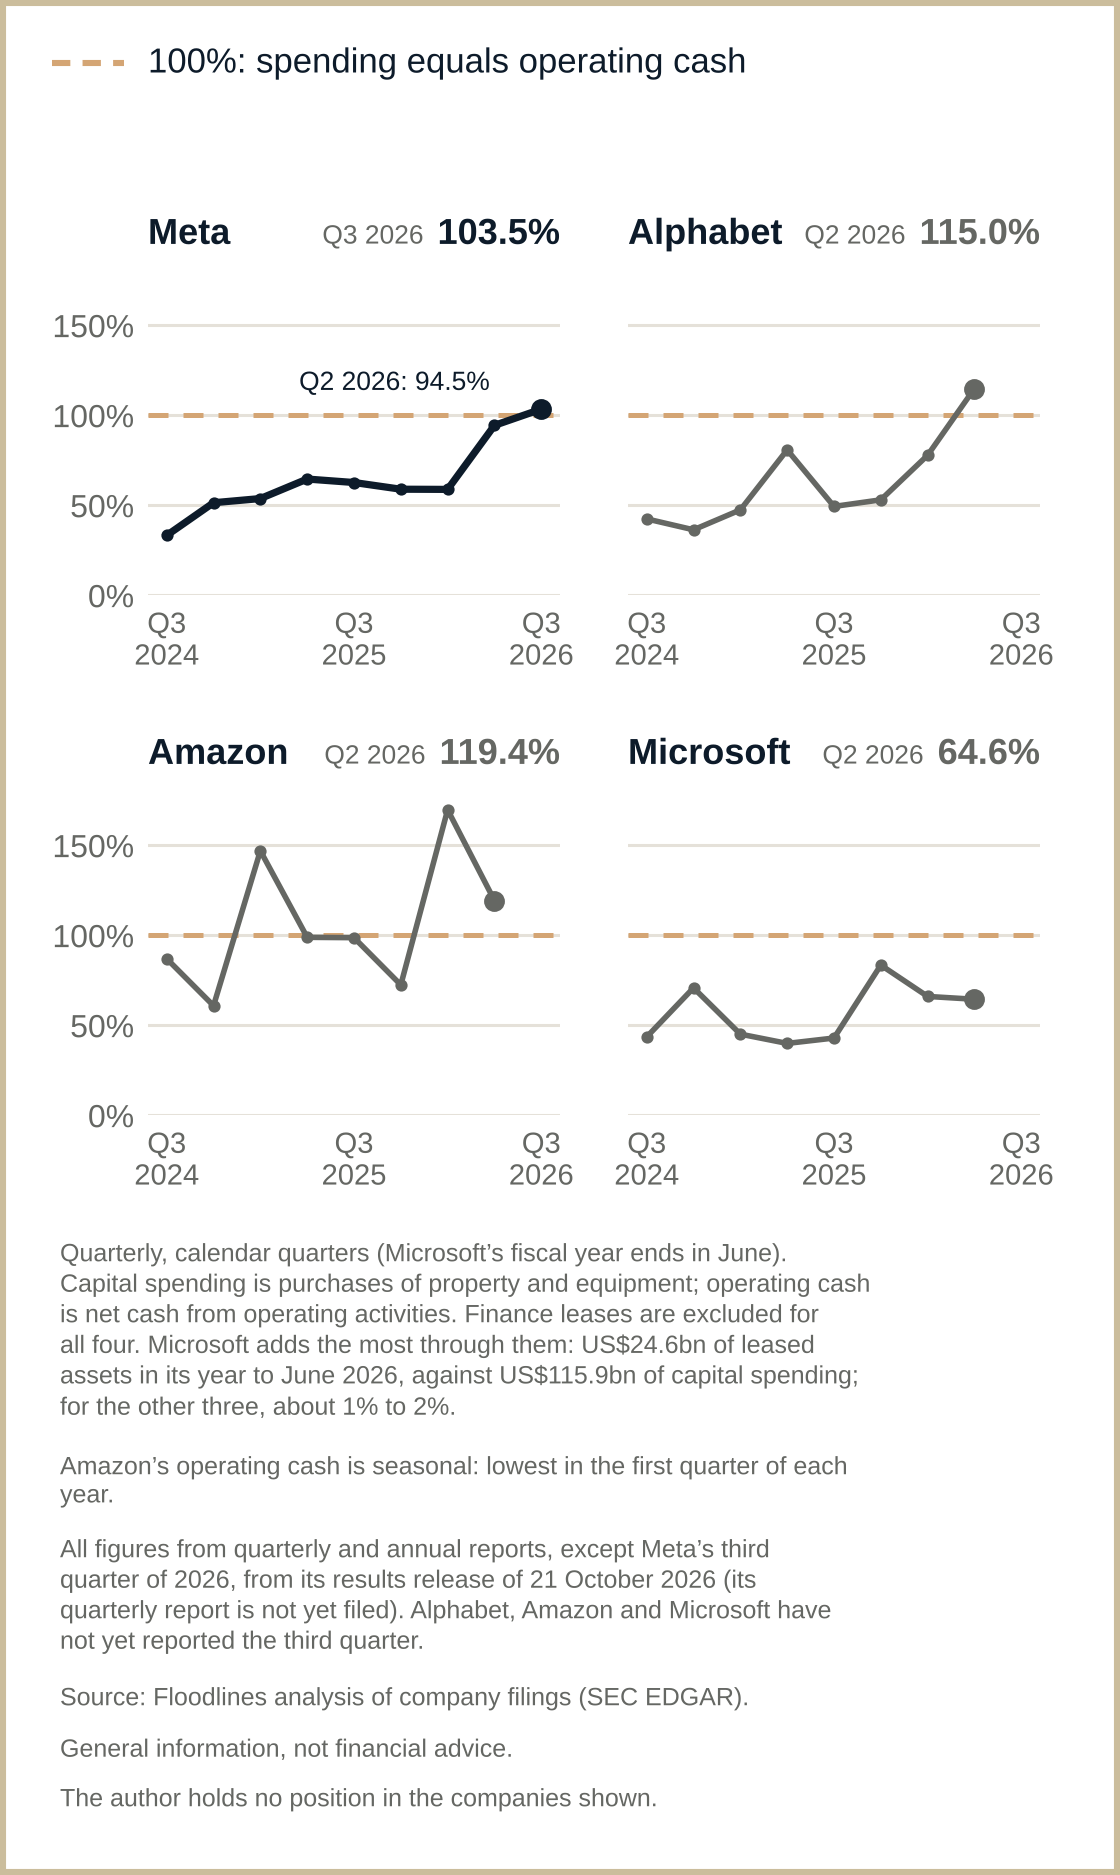
My test, set on 19 October with the 2000 dot-com crash in mind, is cash: "Proof that the AI build-out has largely sustained itself is what will show we are not in a 2000 set-up yet." Is Meta paying for its own spending? Not in the September 2026 quarter: it spent about US$1.04 on capital spending for every US$1 of cash its business brought in (103.5% of its operating cash), and its free cash flow (Meta's own measure, which also counts lease payments) was minus US$2.12bn. So on my test, this quarter's spending was not paid for from cash; it fell short by less than feared, which is why I call this early. The group's test is not decided until the other three report.
Capital spending as a share of operating cash, quarterly; above 100%, spending passes the cash the business brings in.
It was far less bad than feared. Analysts had estimated about minus US$8.5bn (as reported by Shattered on 20 October); the gap came from Meta spending less than expected, not from stronger cash. So far, a positive sign for my cash test.
Is the worst of the AI mood behind us?
I think we have probably hit the worst chapter of AI sentiment, and the mood is on its way back. SpaceX's results on 20 October were strong: a third-quarter operating profit of US$2.79bn, with its AI business, now about half its revenue, in profit in the quarter. I think the AI mood had already begun to turn before Meta reported, and Meta's result supports it. I really hope it holds, if the cash flow proves positive.
Where I stand
If the biggest worry came in better than feared, I expect the other three, taken together, to do the same: it is not 2000, yet. Early: a first sign, not yet a trend. Microsoft, Alphabet and Amazon report on 28 and 29 October (US time). If their combined free cash flow comes in worse than analysts forecast, I'm wrong.
Challenging thoughts
Where the consensus is wrong. The past fortnight's loudest fear, a 2000 replay, assumes an AI build-out that can no longer carry its bill. Meta covered about 97% of its spending from operating cash, and raised no new debt in the quarter.
The best case against me.
- Smaller than feared is not paid for. Why Meta spent less is not yet known, and the other three can beat forecasts the same way.
- Meta was not the weakest on cash: in the second quarter Alphabet's spending used 115.0% of its operating cash and Amazon's 119.4%, against Meta's 94.5% and Microsoft's 64.6%.
- The worst of the mood may not be over. In past sell-offs, lows held only once credit stress had peaked, and for the riskiest junk-rated borrowers it was still rising on 16 October, the last official reading.
My answer: it's about fear, not ranking. The market feared Meta most, so beating that fear matters more than which company is weakest on paper. I read Meta raising the bottom of its 2026 spending range to US$135bn, from US$130bn, as confidence in its own plans.
The question for you. If next week's cash beats forecasts, will you read a smaller bill, or a paid one?
What to watch
- 28 and 29 October 2026 (US time): Microsoft, Alphabet and Amazon report; their combined free cash flow decides my view.
SourcesShow all 10Hide
- Meta: Form 8-K, Exhibit 99.1, 21 October 2026: revenue, purchases of property and equipment, operating cash flow, free cash flow, and the 2026 capital spending range of US$135bn to 145bn (previously US$130bn to 145bn). No new debt in the quarter: the release's cash-flow statement shows no proceeds from long-term debt in the three months to 30 September. The 103.5% (about US$1.04 per US$1), the "about 97%" (operating cash of US$32.79bn against capital spending of US$33.94bn) and the 52.5% are Floodlines calculations from Meta's filings via SEC EDGAR company facts.
- The free cash flow estimate: about minus US$8.52bn, printed as an analyst estimate with no provider named, Shattered, 20 October 2026.
- The pre-results headlines: 24/7 Wall St, 20 October 2026.
- SpaceX: Form 8-K, Exhibit 99.1, 20 October 2026: third-quarter operating income, and the third-quarter revenue and operating income of its AI segment (Super Intelligence).
- Charts A and B, and the second-quarter ratios: Floodlines analysis of company filings (SEC EDGAR) for Meta, Alphabet, Microsoft and Amazon, via SEC EDGAR company facts. Capital spending is purchases of property and equipment (Amazon: productive assets); finance leases excluded; Microsoft's fiscal quarters shown as calendar quarters.
- Combined free cash flow, for the test of my view: each company's net cash from operating activities less cash purchases of property and equipment (Amazon: net of proceeds and incentives), as printed in its September-quarter results release; finance leases excluded.
- The 2000 comparisons: SiliconANGLE, 14 October 2026; Reuters (via MarketScreener), 15 October 2026.
- Credit and past sell-offs: Federal Reserve, Gilchrist-Zakrajšek credit spread, monthly, 2000 to 2025; Floodlines analysis. The riskiest junk-rated borrowers: ICE BofA US High Yield CCC and Lower index, option-adjusted spread, compiled by ICE Data Indices, LLC, via FRED, latest observation 16 October 2026. Index values are not reproduced, under ICE Data Indices' terms.
- My 19 October test: Not 2000. Not yet., Tidelines, 19 October 2026.
- Dates: each company's investor relations page.
Currency: US dollars. Quarters are calendar quarters; Microsoft's fiscal quarters are shown as the calendar quarters they cover.
Company, index and benchmark names are trade marks of their owners and are used only to identify the companies, indices and benchmarks concerned. No company, index owner, benchmark administrator or data publisher named here sponsors or endorses Floodlines.
Important information
General information only. Floodlines is not licensed to provide financial product advice, and nothing here is a recommendation to buy, hold or sell. The author holds no position in any company named. Floodlines is not a registered investment adviser.
Show full termsHide full terms
Important. Floodlines publishes independent research and commentary on the economy, markets, industries and supply chains. It is general information only. Floodlines is not licensed to provide financial product advice and does not provide it. Nothing here is a recommendation to buy, hold or sell any financial product. Nothing here has been prepared by reference to any reader’s objectives, financial situation or needs, and Floodlines does not respond to individual questions about personal circumstances, holdings or portfolios. Views are the author’s own as at the date of publication, may change without notice, and may be wrong. Where a piece says how sure the author is of a view, or what would change her mind, that describes her confidence in her own reading of events. It is not an instruction to any reader. Before making any financial decision, obtain advice from a licensed financial adviser and consider the relevant product disclosure statement or offer document. Where a piece reports the author’s past calls, it is a record of her own process, wrong calls included. Past calls are not an indicator of future performance.
Interests. Companies appear in this piece as businesses, never as investments. Meta, Alphabet, Microsoft and Amazon are named for their published results and spending, and SpaceX for its published results. The author holds no shares, bonds, options or other securities in Meta, Alphabet, Microsoft, Amazon or SpaceX, no credit default swaps or other derivatives on any of them, and no technology, semiconductor, AI or Nasdaq-100 fund. Floodlines receives no payment from any issuer, index owner, underwriter or dealer in connection with anything discussed.
United States readers. Floodlines is a publication of general and regular circulation. It provides impersonal commentary only, does not provide personalised investment advice, does not hold itself out as an investment adviser, and is not registered as an investment adviser with the SEC or any state. Floodlines will not answer questions about your portfolio or circumstances. Floodlines receives no compensation from any issuer, underwriter or dealer in respect of any security discussed.