- Not 2000, not yet: CoreWeave’s borrowing and a hot inflation print brought back the dot-com nightmare. The déjà vu makes sense, but zoom in and we are not in 2000, yet: credit spreads are still tight and profits are rising. In 2000, credit had been getting dearer for a year and profits were falling, on today’s revised figures. With 30% earnings growth expected, positioning early for a bubble burst can be expensive.
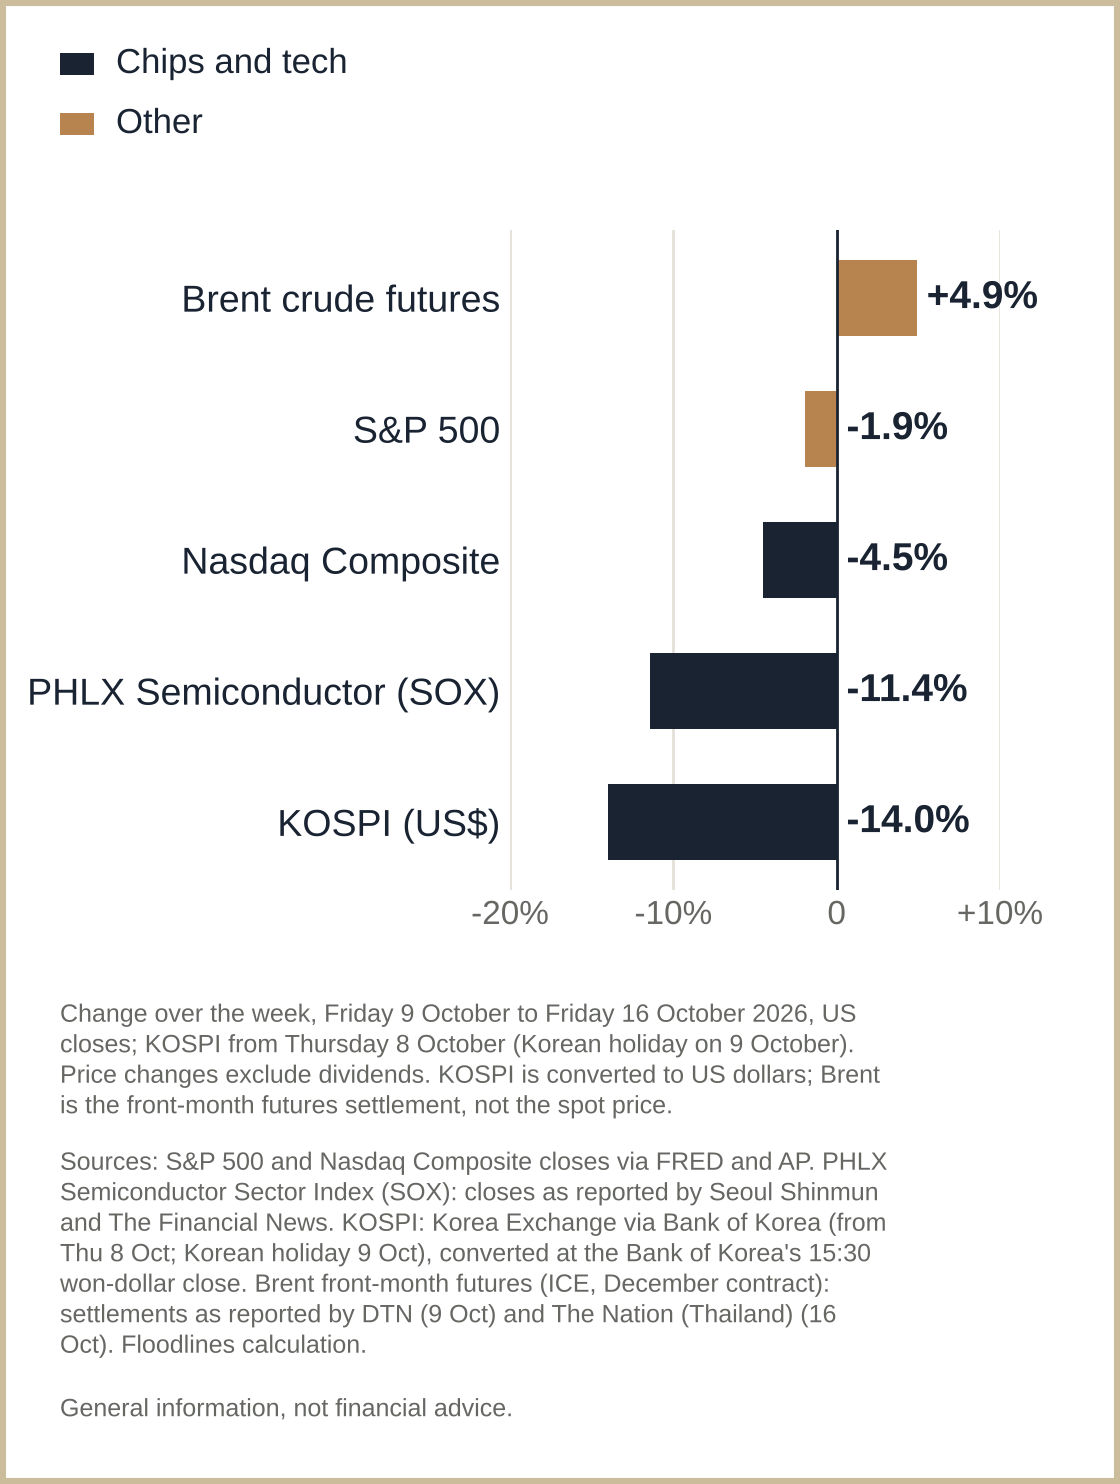
- A chip panic outrunning the fundamentals: a double whammy of bubble fear and oil-led inflation hit chips hard: the Nasdaq Composite fell 4.5%, US chips (SOX) 11% and Korea’s KOSPI 14% in US dollars. TSMC and ASML delivered strong guidance, and both shares declined: no one is in the mood for a party. Strength won’t go unnoticed forever, but the panic has to calm first.
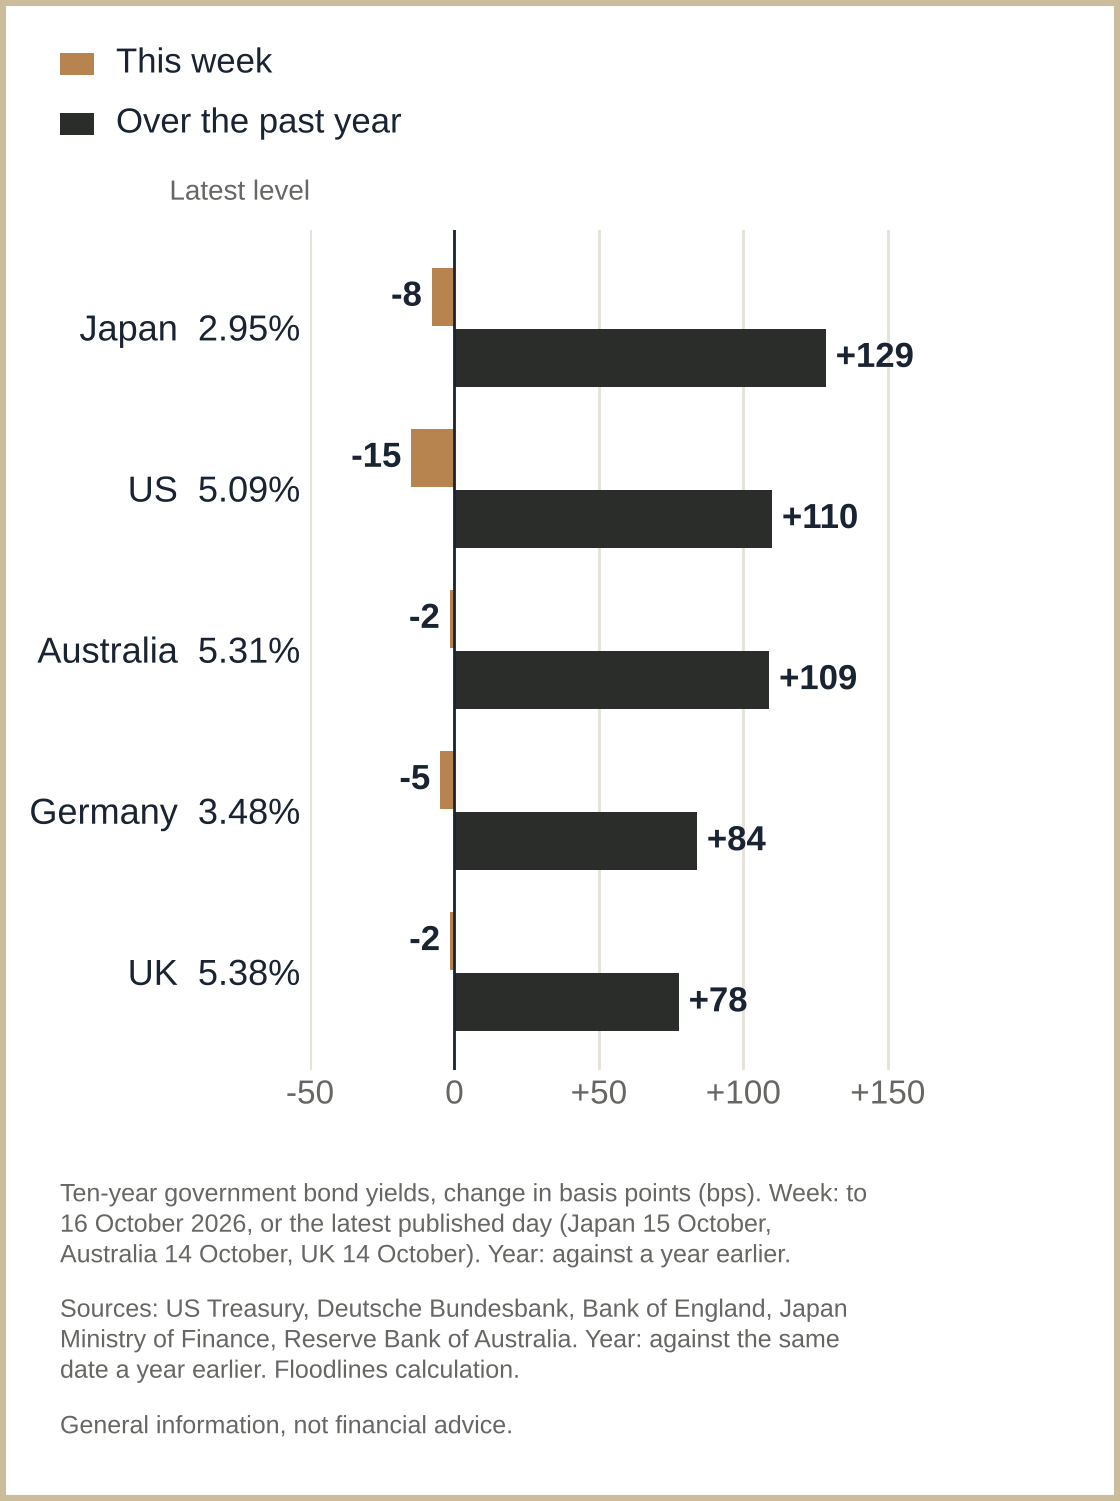
- Bonds cushioned the fall again, at a higher cost: investors still ran to government bonds: 10-year yields fell 15bps in America, 8bps in Japan and 5bps in Germany. But most are still well above a year ago: investors now trust these havens less. Bonds did cushion the stock market’s fall in 2000, with the Fed cutting from January 2001, but if inflation stops the Fed cutting this time, they may protect less. The Fed’s decision on 28 October (US time) is the next test.
- Follow the cash: the real test starts this week: I don’t think investors are walking away from equities: the fundamentals are still sound, and their strength won’t stay ignored for long. But the bar is higher: the AI build-out needs to be largely funded by cash rather than borrowing. I’m putting cash coverage at the top of my scorecard heading into the next two weeks of earnings, when the big cloud spenders report. For now, I’m restraining my urge to trade on mood: I need the facts on my side.
Not 2000, not yet
A viral chart of CoreWeave’s borrowing costs triggered another episode of bubble fear, and brought back the comparison with 2000. The déjà vu makes sense: as in 2000, the Fed is raising rates, credit spreads are widening, business investment is still booming, and oil and inflation are rising. From some angles, 2000 might even have looked better than now: growth of 4.2% against 2.2%, unemployment of 4.0% against 4.2%, inflation about the same.
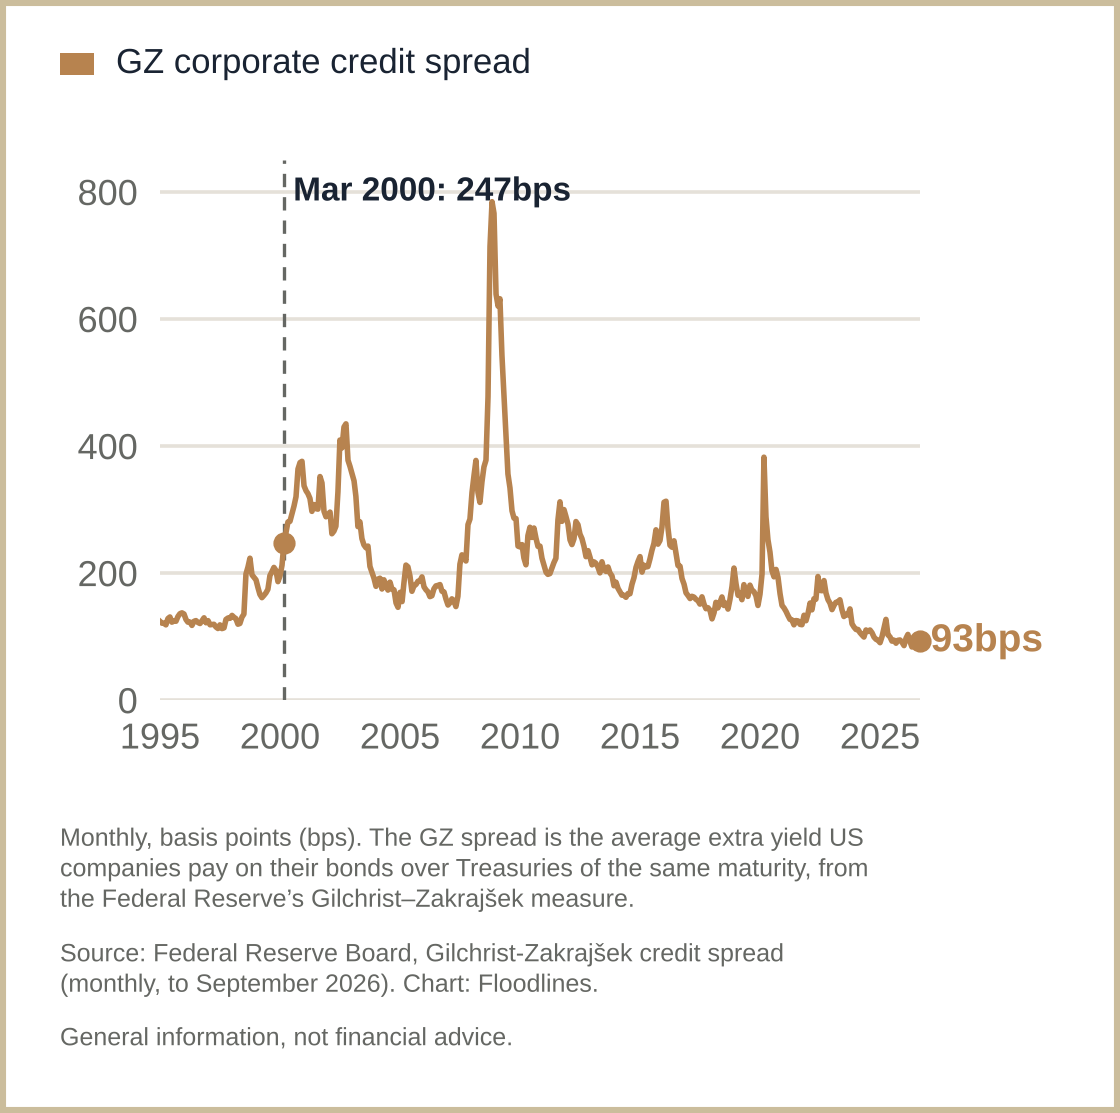
But zoom in, and we are not in 2000, nor in a worse set-up, yet. Start with the macro. By March 2000 the Fed had raised rates five times (a sixth came in May), the yield curve had inverted, and the Fed's GZ spread, what companies pay to borrow over Treasuries, had widened 81bps in a year to 247bps; today, after one hike and no inversion, it is 93bps, up just 3bps in a year and near its lowest tenth since 1973. Much better. The one to watch is junk bonds. Moody’s global junk default rate is 4.5%, against 5.7% in 1999 and 6.1% in 2000; America’s has edged up to 5.3%. Defaults lag and spreads warn first, so the junk spread is one of the tests I’ll focus on, because that is usually where the drama starts.
The Federal Reserve's Gilchrist-Zakrajšek (GZ) corporate credit spread, basis points, monthly, January 1995 to September 2026. March 2000 marked.
The corporate side is better too. In the first quarter of 2000, profits of US companies were already falling on today’s revised figures (BEA), yet company debt grew almost 10% over that year (Federal Reserve), and in March the S&P 500 traded at more than 24 times expected earnings (FactSet). Companies borrowed against growth their profits were not delivering, and shares were priced for it anyway. It did not end well. Today, in the second quarter of 2026, profits are up 18.2% on a year, debt grew 5.4%, and the price is about 19 times (FactSet). S&P 500 earnings are expected to grow about 30% this season (FactSet), much as they did in early 2000. So investors are paying meaningfully less for similar earnings growth.
After-tax profits of all US companies, with inventory valuation and capital consumption adjustments, percent change on a year earlier, quarterly, Q1 1995 to Q2 2026, latest revised figures. Q1 2000 marked.
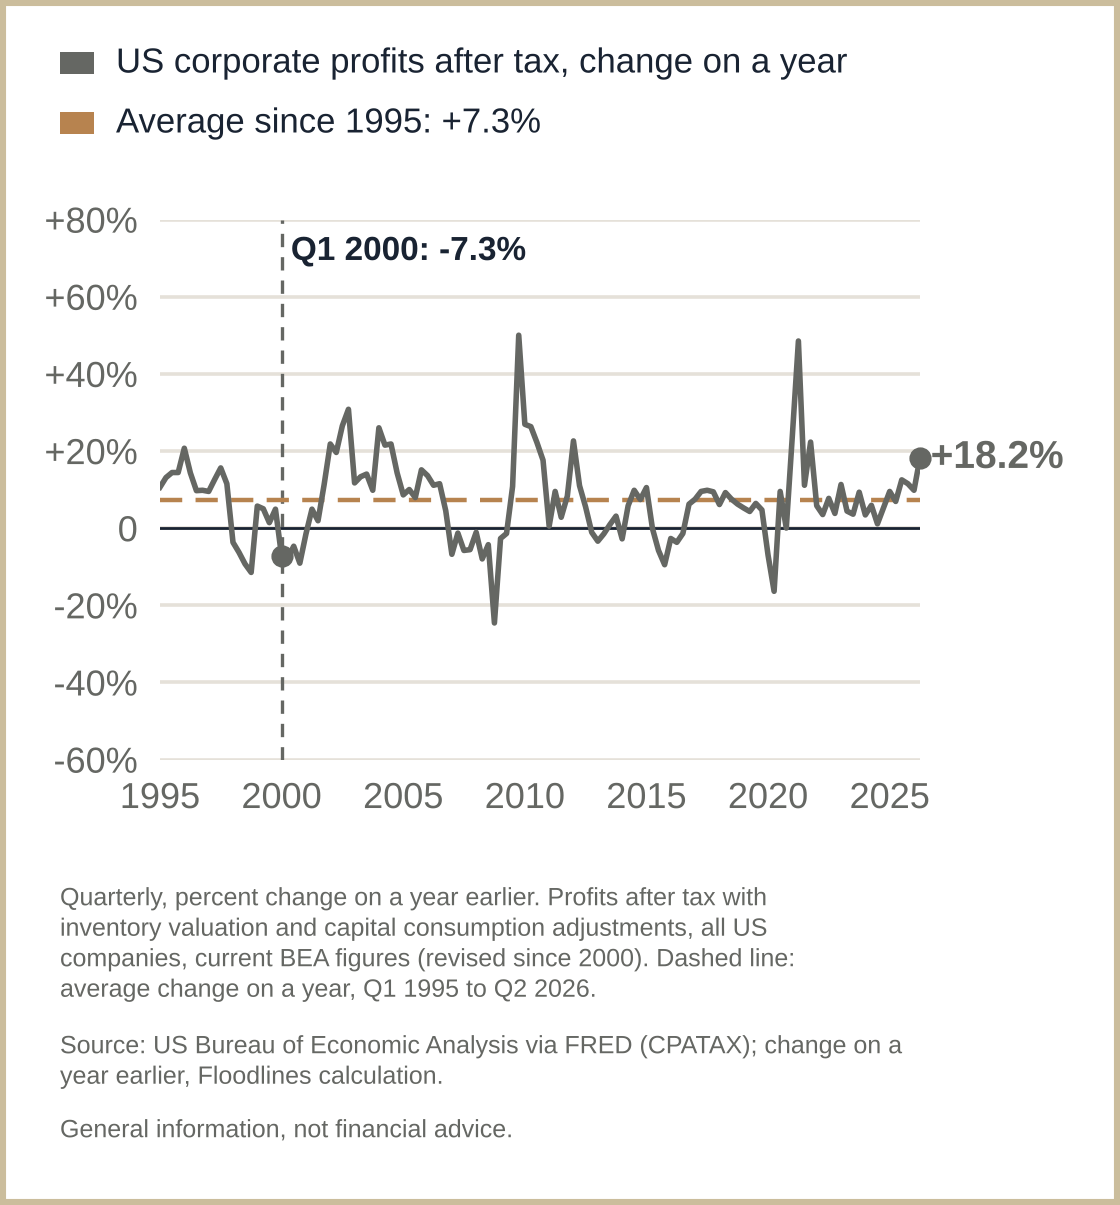
My reading: we are not in 2000, yet, and both the macro and the corporate evidence say so. With earnings growth similar to 2000's, investors are paying less for it, 19 times rather than 24, and credit spreads are still tight. It could be too early to price in a bubble burst. Junk bonds are the indicator I'm watching closely.
A chip panic outrunning the fundamentals
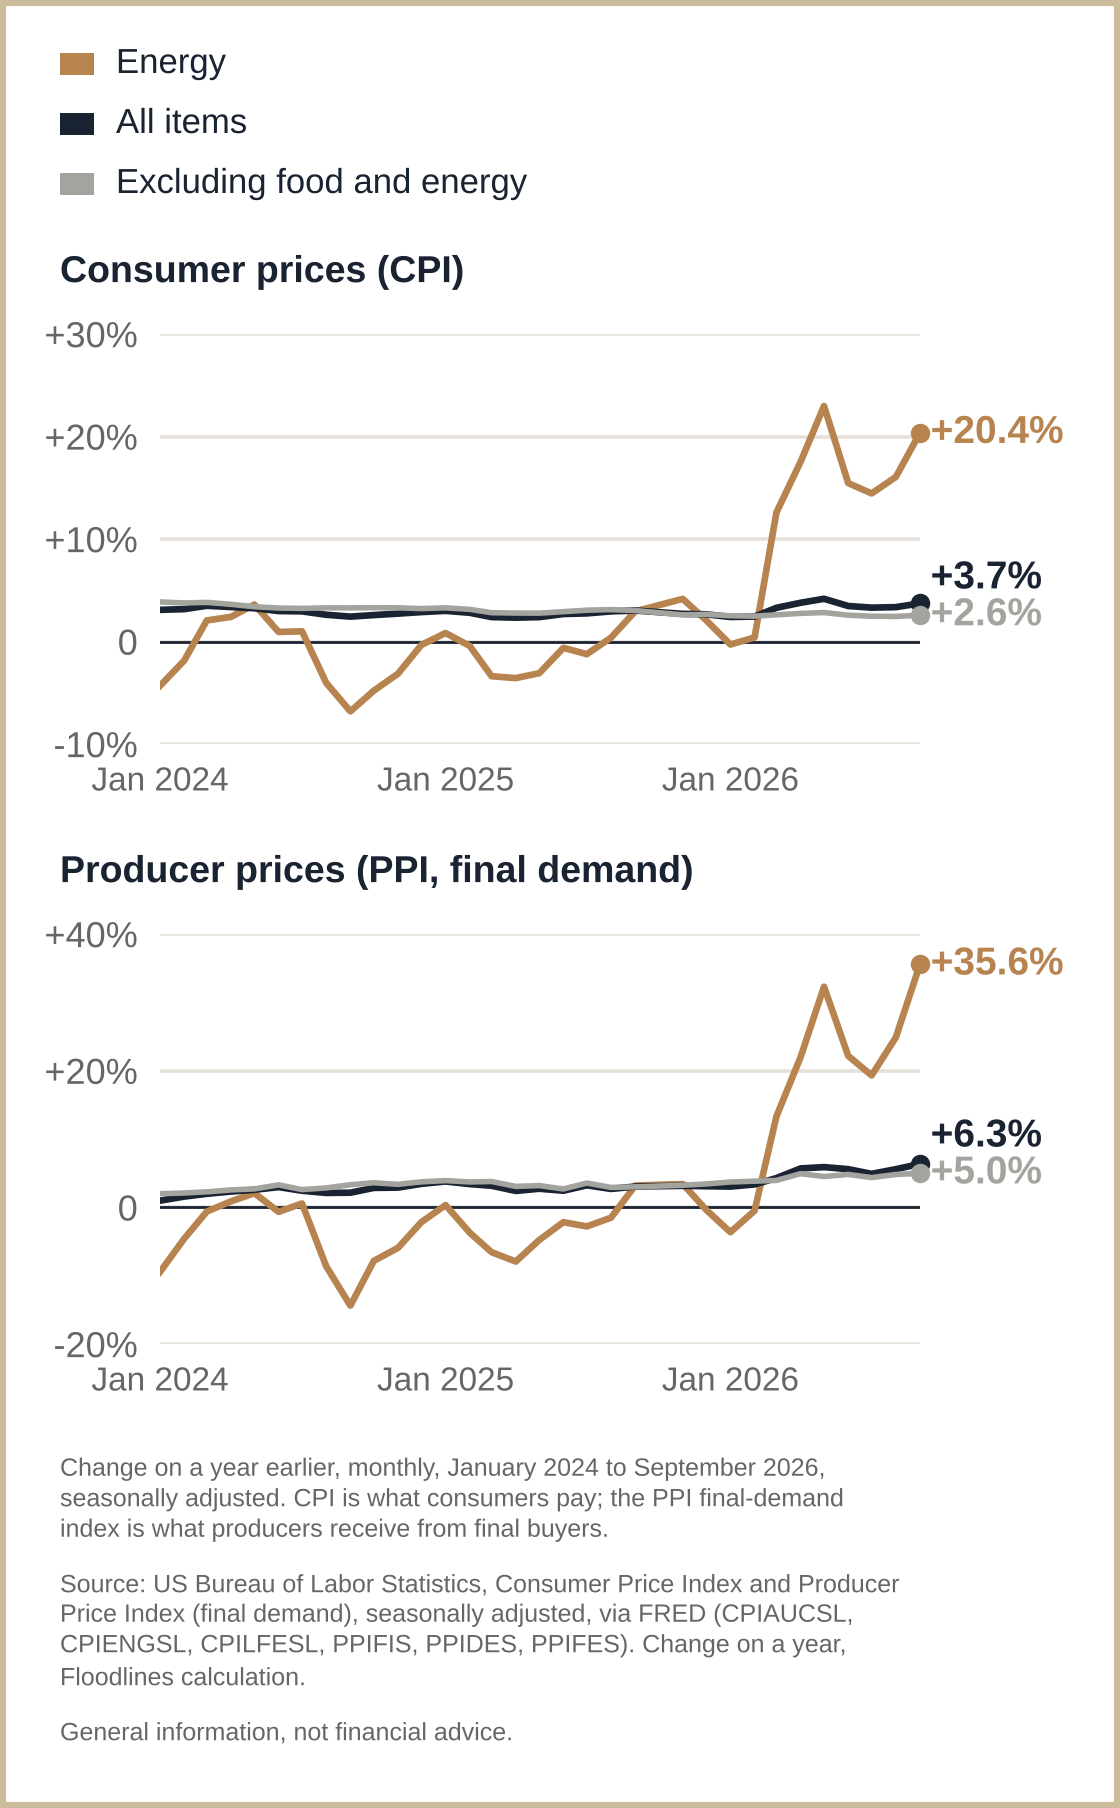
The chip sell-off continued this week, hit by a double whammy: deepening bubble fear, inflamed by worries over CoreWeave's borrowing, and oil-led inflation pressure now plain in both the CPI and PPI prints, suppressing risk appetite. Korea's KOSPI, a concentrated memory-chip trade, fell the hardest: on fear of new competition from China, and as company buybacks that had absorbed foreign selling ran out.
Change over the week, Friday 9 October to Friday 16 October 2026, percent, in US dollars, dividends excluded: S&P 500, Nasdaq Composite, PHLX Semiconductor Sector Index (SOX), KOSPI and Brent crude futures.
US consumer prices (CPI) and producer prices (PPI, final demand): all items, energy, and excluding food and energy, percent change on a year, monthly, January 2024 to September 2026.
Robust results, no party
With investors in panic mode, no one is in the mood for a party. Sorry, AI reporters this week: TSMC beat the top of its own sales forecast range and the Street's estimates, and lifted this year's growth to about 44%, its fastest since 2010; ASML guided next quarter's sales up about 26%. Both delivered strong guidance, and both shares declined. Looking back, Micron's beat on 30 September, before the mood soured, still earned a lift.
AI results: earnings surprise against consensus, and the first-session share move in US dollars. Each dot is one quarterly result from 14 large AI companies; gold marks the three reported so far this season (Micron, ASML, TSMC).
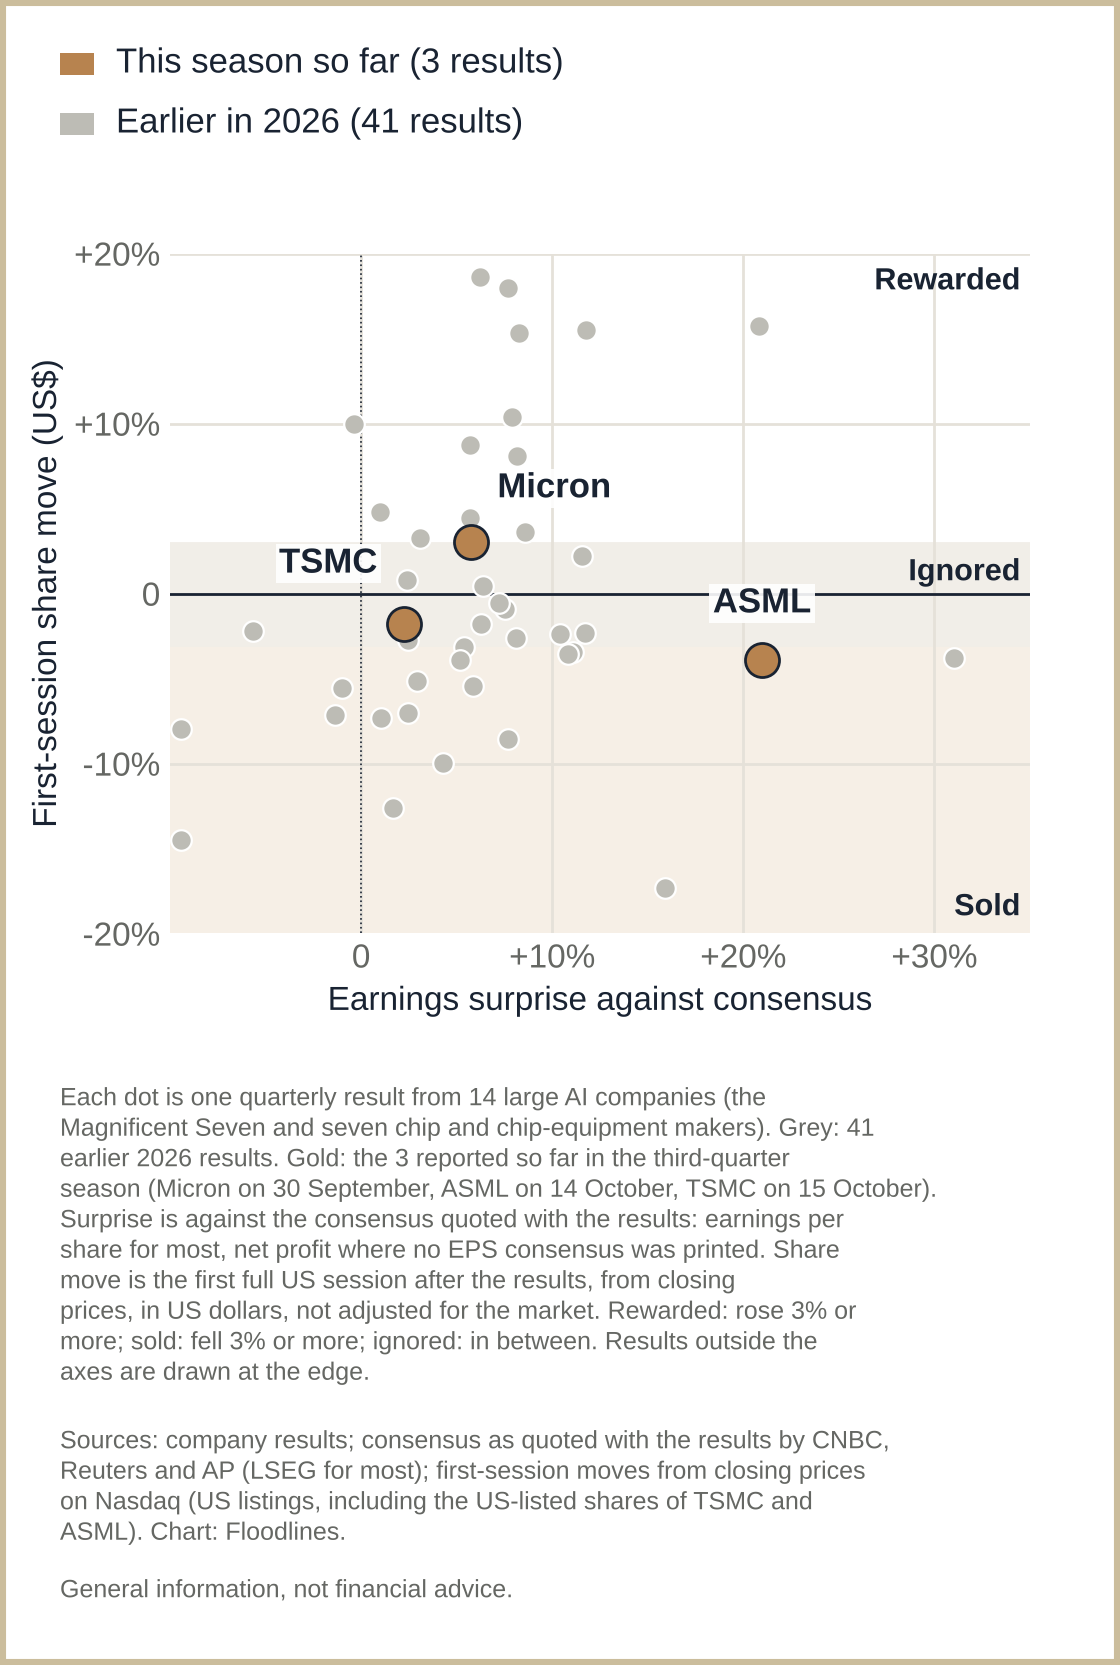
Korea's story has the same theme, louder: rising competition from China and the global sell-off spooked investors out of its memory trade, yet DDR5, the mainstream data-centre memory and the heart of Korea's edge, has not been sold at all, with its spot price up 79% this year (Bloomberg data) and about 4.5% more this month (TrendForce), and no memory maker flagging weaker demand. The fundamentals and the mood have parted ways, and in Korea the gap is even wider than in America.
My reading: fundamental strength, if it continues, won't go unnoticed forever. But the market won't look at it until the panic calms, and that needs the inflation fear to ease, or at least not keep adding fuel to the fire.
Bonds cushioned the fall again, at a higher cost
For the past quarter-century, government bonds, led by America's and followed by Japan's and Europe's, have been the classic havens when the stock market goes south. This time, when the shock hit, investors still went to Treasuries for shelter: America's ten-year yield fell 15bps this week, Japan's 8bps and Germany's 5bps. But most are still significantly higher than just a year ago, Japan's by 129bps, America's by 110bps and Germany's by 84bps, a sign that these havens are now less trusted. So how sustainable could this trade be?
Ten-year government bond yields: change in the week to 16 October 2026 and over the past year, bps. US, Japan, Germany, Britain and Australia. Japan to 15 October, Britain to 14 October.
For anyone who disagrees with me and fears a replay of 2000: back then Treasuries cushioned the fall, because the Fed could stop hiking and cut. If inflation keeps the Fed's hands tied this time, the closer precedent is 2022, when stocks and bonds fell together. Bonds may cushion less than they used to.
My reading: the haven trade is back, for now. How long it lasts, and how much protection it really gives, is still to be tested, and the Fed's decision on 28 October (US time), and how markets take it, is the next test.
Follow the cash: the real test starts this week
With all the context above, I don't think investors are walking away from equities: the fundamentals are still sound, and that won't be ignored for long. But the environment now is a lot more stringent: investors want businesses to pay for their spending with their own cash, not by borrowing at rates near two-decade highs.
That makes me put extra focus on cash flow this season: on my scorecard, how well the cash covers the spending ranks, to an extent, above earnings per share, revenue and margin growth. In the second quarter the four biggest cloud spenders' capex used about 96% of their operating cash flow (close to 100% counting finance leases); above 100%, the gap has to be borrowed or drawn from savings.
Capital spending as a share of operating cash flow, the four biggest cloud spenders combined, percent, quarterly, Q1 2023 to Q2 2026. Finance leases excluded.
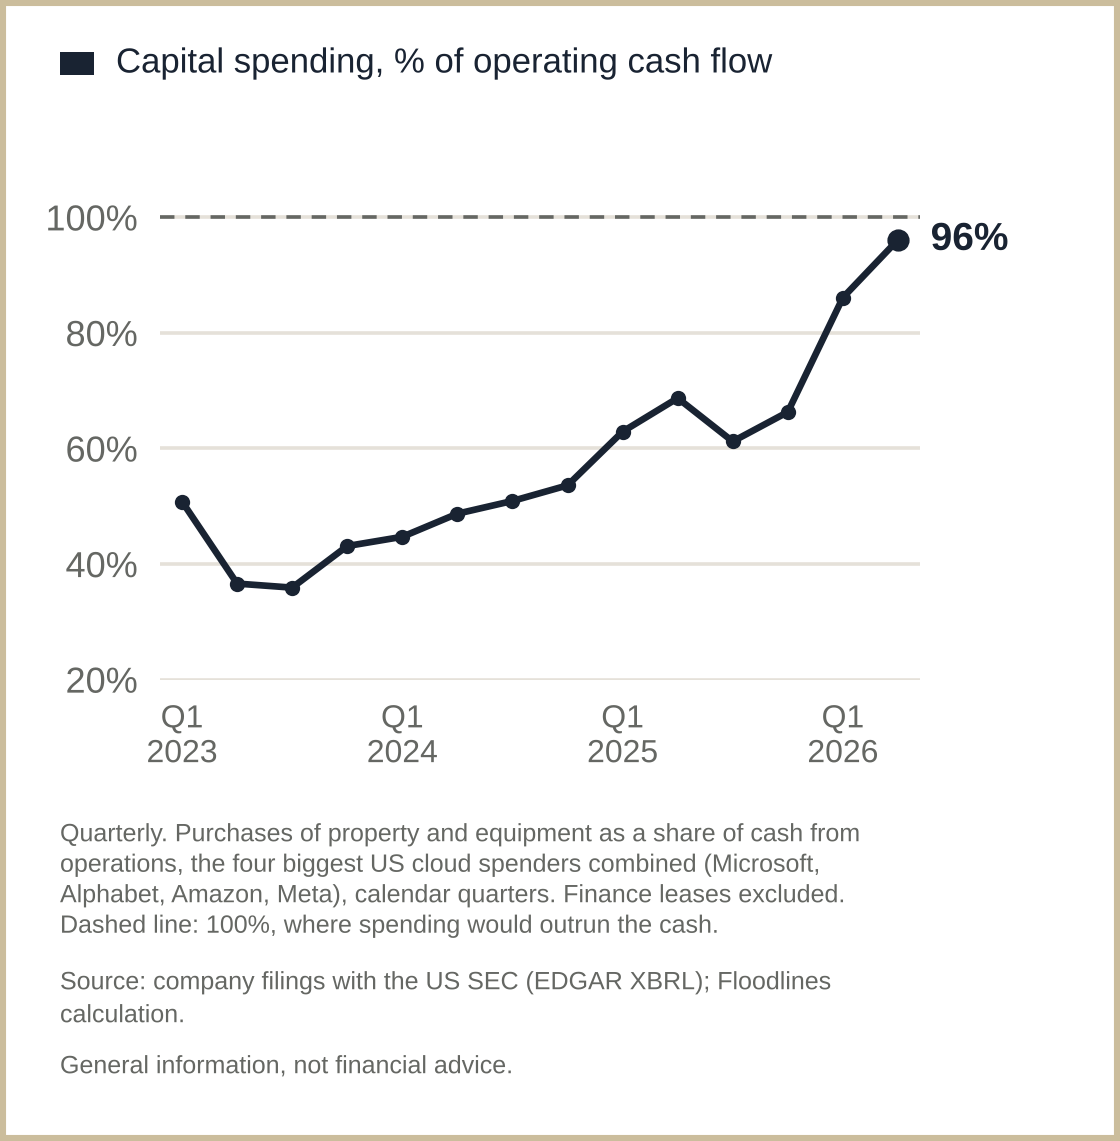
The test begins this week. The major spenders report over the next two weeks, starting with Meta on 21 October (US time), and three things will matter: the cash-flow numbers they report, the language they wrap around them, and how the market takes both. So let the test begin. Until then, I'm restraining the urge to trade on mood: I need the facts on my side.
My reading: in a market this stringent, cash matters more than before. Proof that the AI build-out has largely sustained itself is what will show we are not in a 2000 set-up yet. The test begins this week, and I'll be watching closely.
The tide
The sentiment-driven sell-off in chip and AI stocks over the past two weeks has outrun the fundamentals. Conviction: leaning. I understand the fear of a 2000 replay, but we are not there, yet. Still, I respect the power of sentiment: when it rains, it pours. Investors could return to the party once they come back to the reality of fundamental strength; the key question is when. My answer: when the market has passed three tests. One, inflation stops adding fuel to the fire. Two, junk bonds don't blow out. Three, the AI build-out proves it can still largely pay for itself. That changes my view if, over the coming weeks, DDR5 memory-chip spot prices (TrendForce) fall about a tenth, or one of the four biggest cloud spenders cuts or delays its spending because demand has softened.
The week as a test
| When (Sydney) | What | What it decides |
|---|---|---|
| Mon 19 Oct, 13:00 | China Q3 GDP | Is the export boom carrying China? |
| Wed 21 Oct, 17:00 | UK CPI (September) | Britain's own bond premium |
| Thu 22 Oct, 07:30 | Meta and Lam Research results (Wed 21 Oct, US) | Orders held or cut; the first cloud spender's plan |
| Thu 22 Oct, about noon | Bank of Korea | Stability first, or inflation first? |
| Wed 28 Oct, 11:30 | Australia CPI (September) | Is inflation adding fuel at home? Sets up the RBA on 3 November |
| Thu 29 Oct, 05:00 | The Fed's decision and Powell's press conference | Hold or hike: are the Fed's hands tied? |
| Thu 29 Oct, 23:30 | US Q3 GDP and September PCE inflation | Test one in the Fed's own gauge: is inflation still adding fuel? |
| Fri 30 Oct, 00:15 and about 14:00 | ECB and Bank of Japan decisions | Are the other havens tightening too? |
| Late Oct | The other cloud spenders' results | Does spending pass 100% of their cash (test three)? |
| Wed 4 Nov | US midterm results | Does the mood outlast the vote? |
SourcesShow all 19Hide
- Cover: Floodlines (AI-generated image).
- The viral chart and the sell-off: SiliconANGLE, 14 October 2026; Reuters (via MarketScreener), 15 October 2026. CoreWeave made no filing or announcement of its own that week.
- Growth, jobs and rates, 2000 and now: real GDP, BEA via FRED (GDPC1); unemployment, BLS via FRED (UNRATE); Fed target rate, via FRED (DFEDTAR); 10-year less 2-year Treasury spread, via FRED (T10Y2Y). Floodlines calculation.
- US inflation: BLS, Consumer Price Index, September 2026 (released 14 October) and BLS, Producer Price Index, September 2026 (released 15 October); chart 2a from the six BLS series via FRED.
- Credit spread: Federal Reserve, Gilchrist-Zakrajšek credit spread and excess bond premium, read 17 October 2026: 2.47% in March 2000 (1.66% in March 1999), 0.93% in September 2026; percentile over January 1973 to September 2026, Floodlines calculation.
- Junk-bond default rates: Moody's, Default and Recovery Rates of Corporate Bond Issuers, 1920-2004, Exhibit 15 (global speculative-grade, 1999 and 2000); Moody's global and US rates for August 2026 as reported by First Trust, 17 September 2026.
- Profits: US Bureau of Economic Analysis, corporate profits after tax with inventory valuation and capital consumption adjustments, via FRED (CPATAX), vintage of 30 September 2026: +18.2% on a year in Q2 2026, -7.3% in Q1 2000; Floodlines calculation. Figures published at the time: Federal Reserve, Monetary Policy Report, 13 February 2001.
- Company debt: Federal Reserve, Financial Accounts of the United States (Z.1), nonfinancial corporate debt securities and loans, via FRED (BCNSDODNS): +9.7% in the year to Q1 2000, +5.4% in the year to Q2 2026; Floodlines calculation.
- Earnings and valuation: FactSet Earnings Insight, 16 October 2026 (third-quarter growth estimate, forward 12-month P/E and its five-year average, in words); FactSet Earnings Insight, 24 January 2020 (the March 2000 forward P/E peak, in words); S&P 500 reported 12-month earnings in early 2000, S&P Dow Jones Indices data as compiled by multpl.com.
- The week's moves (chart 2): S&P 500 and Nasdaq Composite closes via FRED (SP500, NASDAQCOM), 9 October, and AP, 16 October 2026. PHLX Semiconductor Sector Index (SOX): closes as reported by Seoul Shinmun, 10 October 2026, and The Financial News, 17 October 2026; Floodlines calculation. KOSPI: Korea Exchange via Bank of Korea (ECOS 802Y001), 8 and 16 October, converted at the Bank of Korea's 15:30 won-dollar close (731Y003). Brent crude futures (ICE, December contract): settlements as reported by DTN, 9 October 2026 (US$104.72) and The Nation (Thailand), 17 October 2026 (US$109.86, 16 October); Floodlines calculation.
- Korea: foreign selling and the end of company buybacks, Seoul Economic Daily, 14 October 2026 and Financial News, 14 October 2026; the CXMT DDR5 plan, Reuters, 13 October 2026.
- Results: ASML, Form 6-K, 14 October 2026 (fourth-quarter sales guidance EUR 14.2bn to 15.2bn, midpoint about +26% on the third quarter); TSMC, Form 6-K, 15 October 2026 (third-quarter revenue US$46.72bn, against guidance of US$44.6bn to 45.8bn); 2026 US-dollar revenue growth of about 44% from the results call, Focus Taiwan, 15 October 2026.
- AI results chart (chart 2c): company results; consensus as quoted with the results by CNBC, Reuters and AP (LSEG for most, in words); first-session moves from closing prices on Nasdaq (US listings, including the US-listed shares of TSMC and ASML), read 18 October 2026; Floodlines calculation.
- Memory-chip prices: DDR5 spot price, year to date, Bloomberg data; month to date, TrendForce, DDR5 spot price, read 16 October 2026.
- Ten-year yields: US Treasury, daily par yield curve (5.24% on 9 October, 5.09% on 16 October, 3.99% on 16 October 2025); Deutsche Bundesbank, 10-year yield (zero-coupon); Ministry of Finance Japan, 10-year JGB (to 15 October); Bank of England, 10-year nominal par yield (to 14 October); Reserve Bank of Australia, F2, 10-year (to 14 October). Countries' conventions differ, so the chart compares changes, not levels.
- The Fed: Federal Reserve meeting calendar.
- Capital spending and operating cash (chart 4): Floodlines analysis of the quarterly filings of Microsoft, Alphabet, Amazon and Meta, listed here to disclose the method, via SEC EDGAR company facts. Capital spending is purchases of property and equipment (Amazon: productive assets); finance leases excluded. Including finance leases, the second-quarter figure is 97.6% to about 100%. Results dates from each company's investor relations page.
- Junk-bond gauge: US high-yield corporate bond index, option-adjusted spread, compiled by ICE Data Indices, LLC, via FRED. Index values are not reproduced, under ICE Data Indices' terms.
- The week as a test: release calendars of the National Bureau of Statistics of China, the Office for National Statistics, the Bank of Korea, the Australian Bureau of Statistics, the Federal Reserve, the Bureau of Economic Analysis, the European Central Bank and the Bank of Japan, read 18 October 2026 (ECB and Bank of Japan times are their usual slots); Meta (12 October) and Lam Research (30 September) results announcements. Times are Sydney (AEDT).
Currency: index changes are in US dollars, with the KOSPI converted at the Bank of Korea's 15:30 won-dollar closing rate; they exclude dividends. Oil is in US dollars a barrel. Yields are in percent; changes are in basis points (bps), with 100bps equal to one percentage point.
Company, index and benchmark names are trade marks of their owners and are used only to identify the companies, indices and benchmarks concerned. That includes the PHLX Semiconductor Sector Index (SOX), owned by Nasdaq, Inc. No company, index owner, benchmark administrator or data publisher named here sponsors or endorses Floodlines.
Important information
General information only. Floodlines is not licensed to provide financial product advice, and nothing here is a recommendation to buy, hold or sell. The author holds no position in any company named. Floodlines is not a registered investment adviser.
Show full termsHide full terms
Important. Floodlines publishes independent research and commentary on the economy, markets, industries and supply chains. It is general information only. Floodlines is not licensed to provide financial product advice and does not provide it. Nothing here is a recommendation to buy, hold or sell any financial product. Nothing here has been prepared by reference to any reader’s objectives, financial situation or needs, and Floodlines does not respond to individual questions about personal circumstances, holdings or portfolios. Views are the author’s own as at the date of publication, may change without notice, and may be wrong. Where a piece says how sure the author is of a view, or what would change her mind, that describes her confidence in her own reading of events. It is not an instruction to any reader. Before making any financial decision, obtain advice from a licensed financial adviser and consider the relevant product disclosure statement or offer document. Where a piece reports the author’s past calls, it is a record of her own process, wrong calls included. Past calls are not an indicator of future performance.
Interests. No company in this piece is discussed as an investment. CoreWeave, Micron, TSMC and ASML are named as the subjects of news reports and results, and CXMT only as the subject of a news report. Meta and Lam Research are named only for the dates of their results, and Meta, Microsoft, Alphabet and Amazon only as a group, for their combined capital spending and operating cash flow; the chart shows them as a group and they are listed in the Sources only to disclose its method. The author holds no position in any of these companies (in CoreWeave's case, its shares, bonds or other securities), in any technology, semiconductor, AI or Nasdaq-100 fund, in options or futures on the PHLX Semiconductor Sector Index, or in US interest-rate futures or options, and no short position in US Treasuries. The author also holds no position in CXMT. Other companies appear only as sources of news and data. The indices, the Brent oil price, government bond yields and corporate bond spreads are used only as measures of markets. Floodlines receives no payment from any issuer, index owner, underwriter or dealer in connection with anything discussed.
United States readers. Floodlines is a publication of general and regular circulation. It provides impersonal commentary only, does not provide personalised investment advice, does not hold itself out as an investment adviser, and is not registered as an investment adviser with the SEC or any state. Floodlines will not answer questions about your portfolio or circumstances. Floodlines receives no compensation from any issuer, underwriter or dealer in respect of any security discussed.