Tidelines
America's Problem
America's problem is funding its economy at an affordable cost. Lenders charge more for the wait, oil and high yields squeeze the Fed, and AI becomes its own worst enemy.

AI asks the world to wait for its payoff; oil and debt make the wait increasingly expensive.
- Lenders still lend to America, but they charge more for the wait: the term premium hit 0.98% on 7 October, its highest since 2014, yet demand at last week's 10-year auction was strong.
- The Fed's main fight is still surging oil, not data centres: energy is all of this year's rise in US inflation; AI is in the Fed's words and, so far, only a little in prices.
- AI becomes its own worst enemy: doubt about OpenAI's revenue sent chips down nearly three times as far as the Nasdaq on 8 October, another episode of AI bubble fear. Investors have got used to the AI chip leaders doubling their revenue, so any doubt hits hard. The upcoming earnings season is an important test of the market's attitude.
Lenders still lend to America, but they charge more for the wait
US 10-year Treasury yield, real yield and breakeven inflation, percent, daily, 9 October 2023 to 9 October 2026.
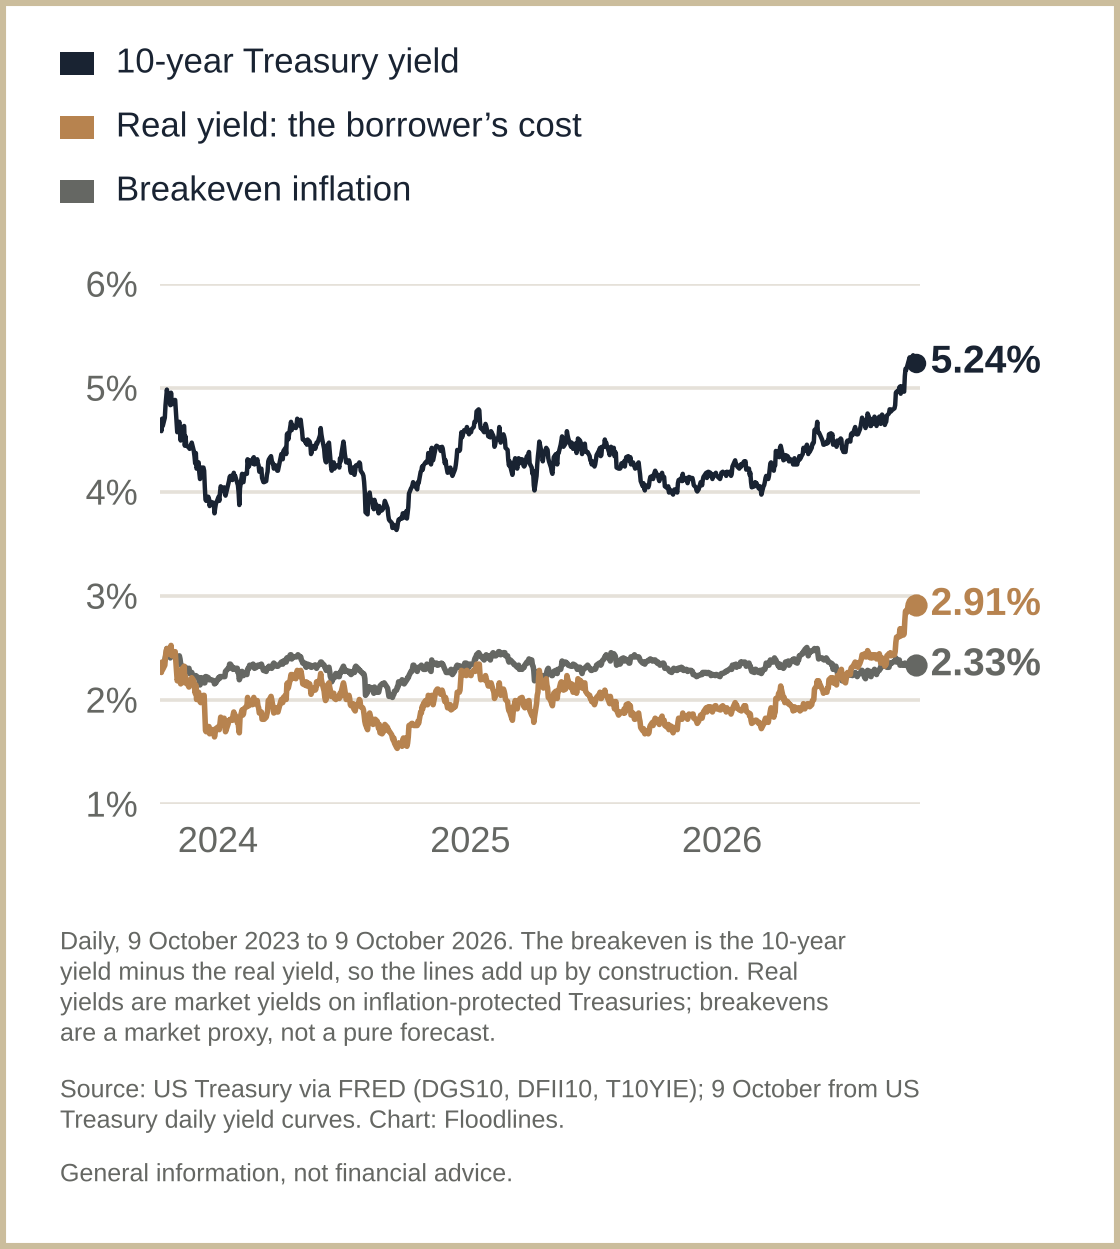
The 10-year Treasury yield is up 106bps this year, to 5.24%, close to its highest since 2007: 98bps of it in the real yield, now near its highest since 2008, and just 8bps in breakeven inflation. Most of that rise is markets expecting short-term rates to stay higher for an extended time. Interestingly, in the three weeks from the Fed's September hike to 8 October, the whole rise in the yield was term premium, the extra yield lenders demand for the wait. It hit 0.98% on 7 October, the highest since 2014. A higher term premium is a higher price on every long-term dollar America borrows, and as its debt rolls over, that price flows into the interest bill.
Yet the auctions are still snapped up. At last week's 10-year auction, bids came to 2.77 times the bonds on offer, and dealers, the buyers of last resort, were left with 2.5% of the bonds, their smallest share since at least 2009. My reading: America is still America, the centre of global finance. The world keeps lending. But the wait is getting more expensive, and a price for the wait can become a price for trust.
Britain has been here before
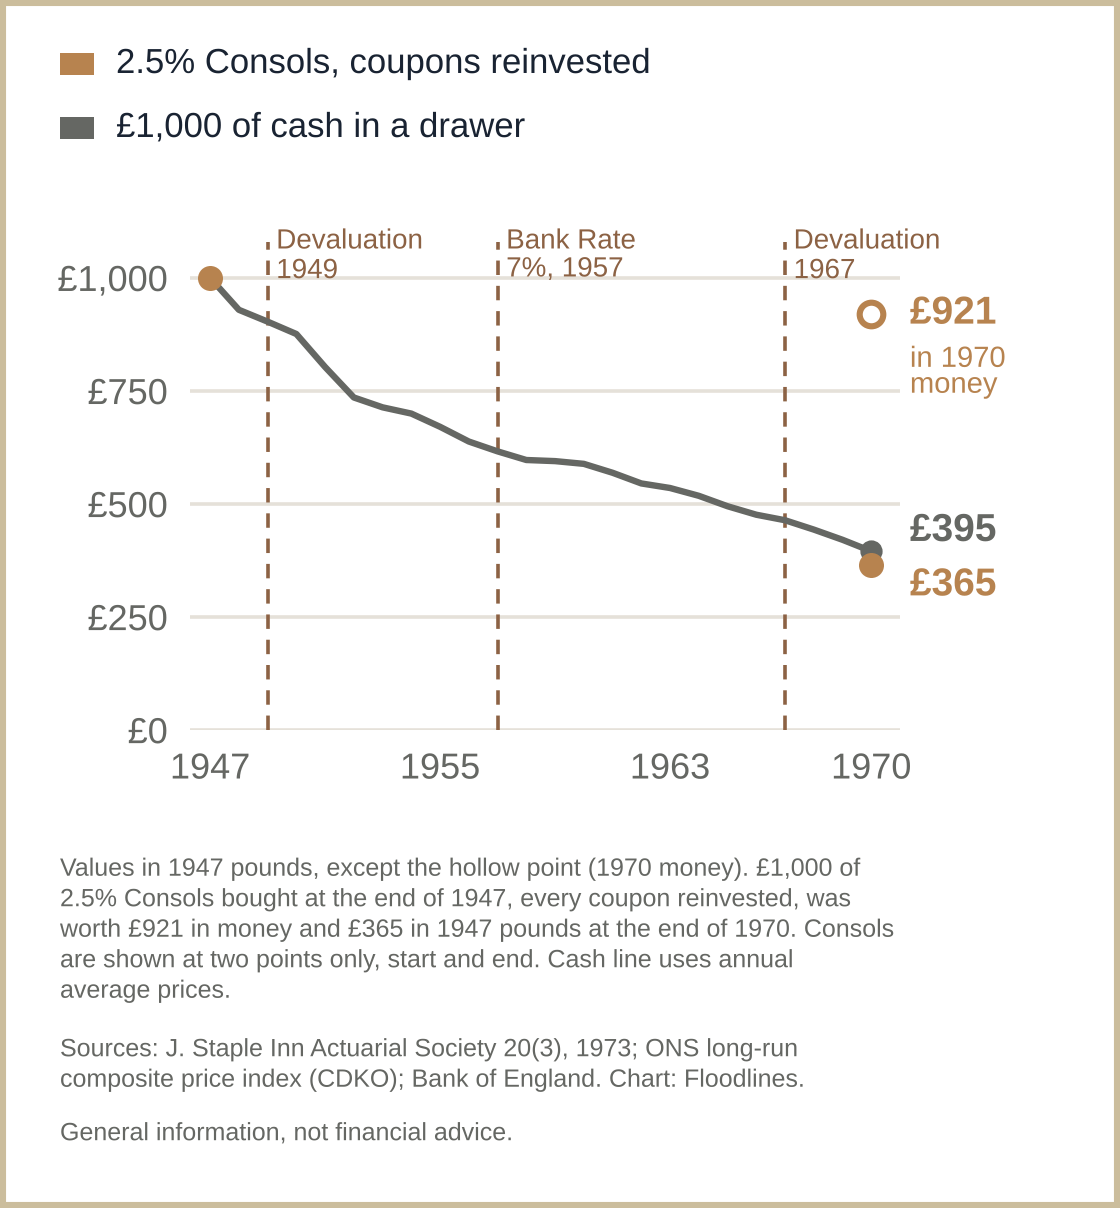
It is the price, not the clock, that matters. After 1947 Britain's Consols, its perpetual government bonds, always found buyers, helped by exchange controls that kept British savings at home. Yet holders who reinvested every coupon lost more than half their buying power to inflation by 1970, about the same as cash in a drawer: they were paid less than prices rose.
What £1,000 was worth in 1947 pounds, end-1947 to end-1970: 2.5% Consols with every coupon reinvested, against cash in a drawer. The hollow point is in 1970 money.
The Fed's main fight is still surging oil, not data centres
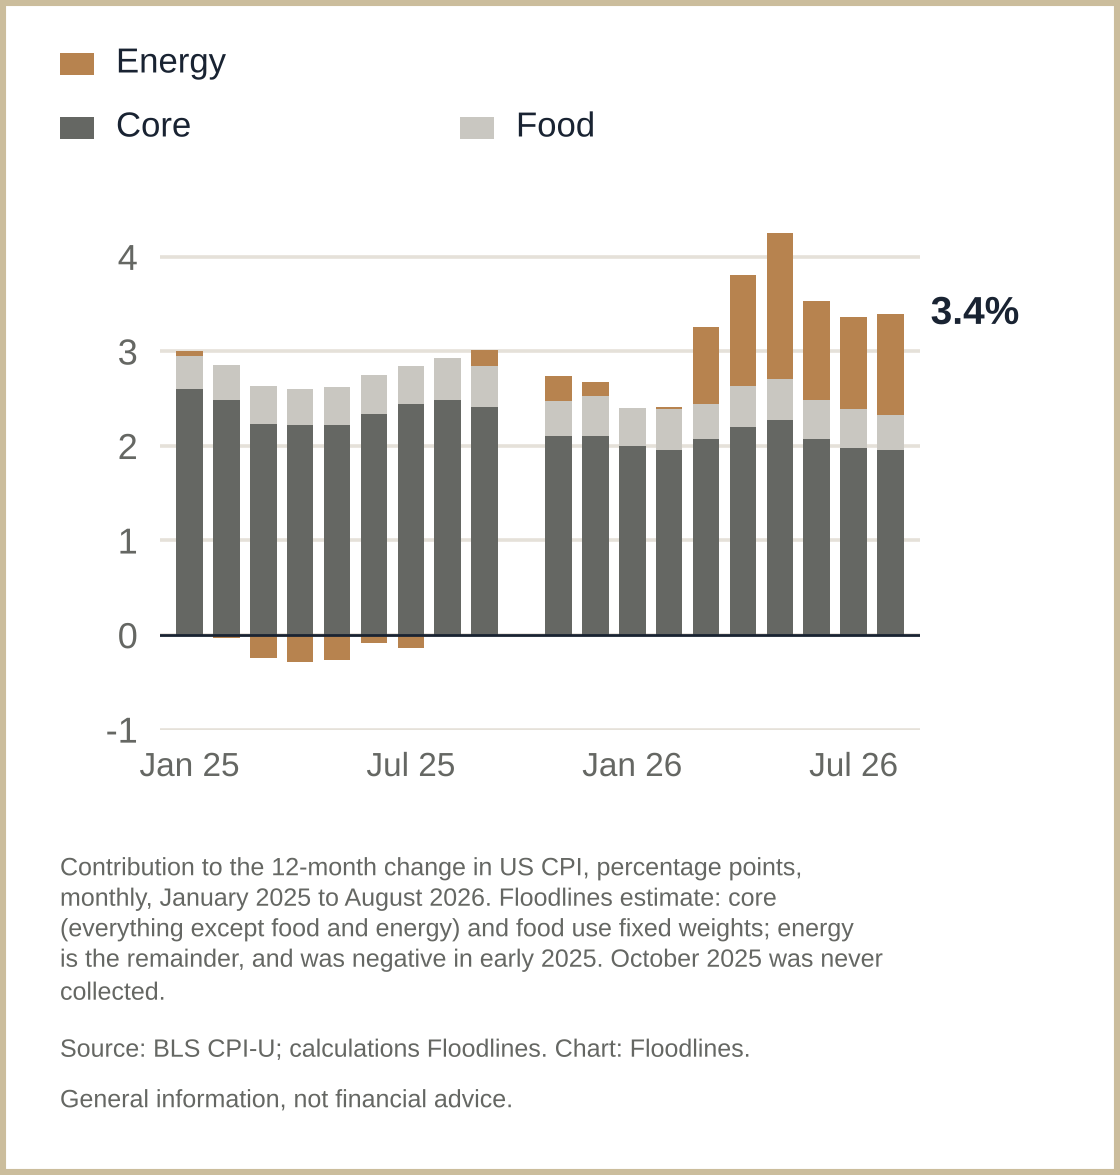
Energy accounts for all of this year's rise in US inflation. The Fed's minutes name AI as one more reason to blame, but its impact on the consumer's basket is limited: computers and phones are less than 1% of it. The first votes for a hike came in July, and the Fed hiked in September; in between, Brent spot rose 39%. Oil is the Fed's main fight for now, not data centres.
What makes up US CPI inflation: contributions of energy, food and core, percentage points, January 2025 to August 2026.
My reading: history shows oil-led inflation sticks once it gets into wages, as in the 1970s; so far, wage growth is slowing. I'm watching the wage prints in the coming months. If wages start to climb, we could be looking at a December hike and more after it, with bond yields leaving the Fed between a rock and a hard place.
AI becomes its own worst enemy
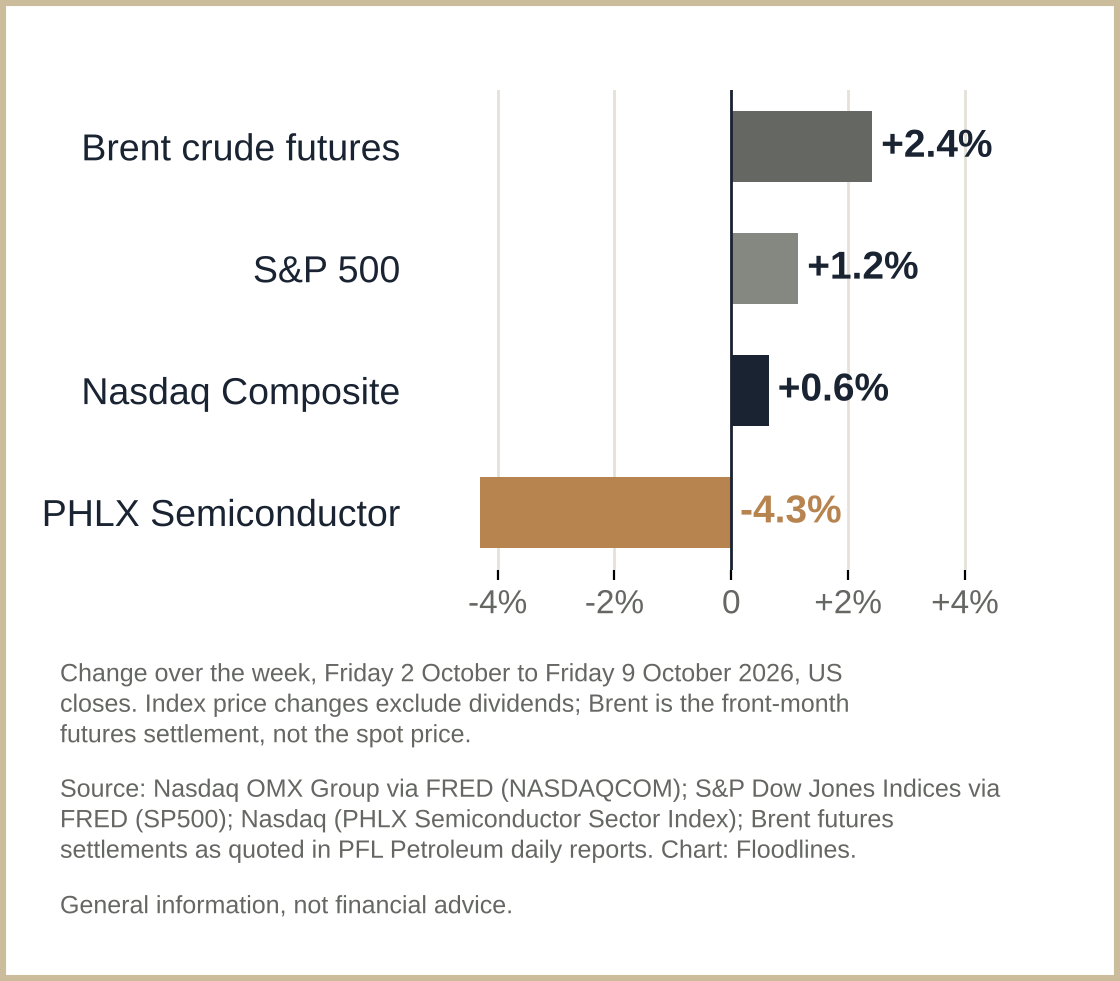
Over the week, chips fell 4.3% while the Nasdaq rose 0.6%, the S&P 500 1.2% and Brent futures 2.4%, and the US 10-year yield fell 4bps, to 5.24%. Last week's chips selloff was about AI fear, not oil or bond yields. On 8 October a Financial Times report questioning OpenAI's revenue exacerbated the selloff: after falling 1.1% the day before, chips fell 3.4%, nearly three times the Nasdaq. It was the latest of several AI scares since China's DeepSeek model in January 2025, when chips fell 9.2%, also three times the Nasdaq: the scares keep coming.
Change over the week, Friday 2 October to Friday 9 October 2026, US closes: Brent crude futures, the S&P 500, the Nasdaq Composite and the PHLX Semiconductor Sector Index.
My reading: chipmakers have gradually become victims of their own success. Any slip or doubt can trigger an outsized market reaction, as the higher the stocks climb, the more investors ask whether the spending will pay off.
Healthy earnings, an indifferent market
The final results season of the year starts on Wednesday, and I see it as an important test of the market's confidence in the outlook for AI, especially semiconductors. Through this year's three results seasons, the bar for rewarding AI companies has looked high. Despite strong results each season, many were sold or ignored afterwards: across 14 of the biggest AI companies, 23 of 42 results this year beat forecasts and were still sold or ignored.* The last season showed a slight turnaround, however: only 6 of the 14 beat and were still sold or ignored, against 7 and 10 in the first two seasons. A slight miss against forecasts can still send a stock lower, however fast its revenue is growing.
AI results in 2026: earnings surprise against the next session's share move, 42 results from 14 large AI companies (listed in Sources), January to September 2026.
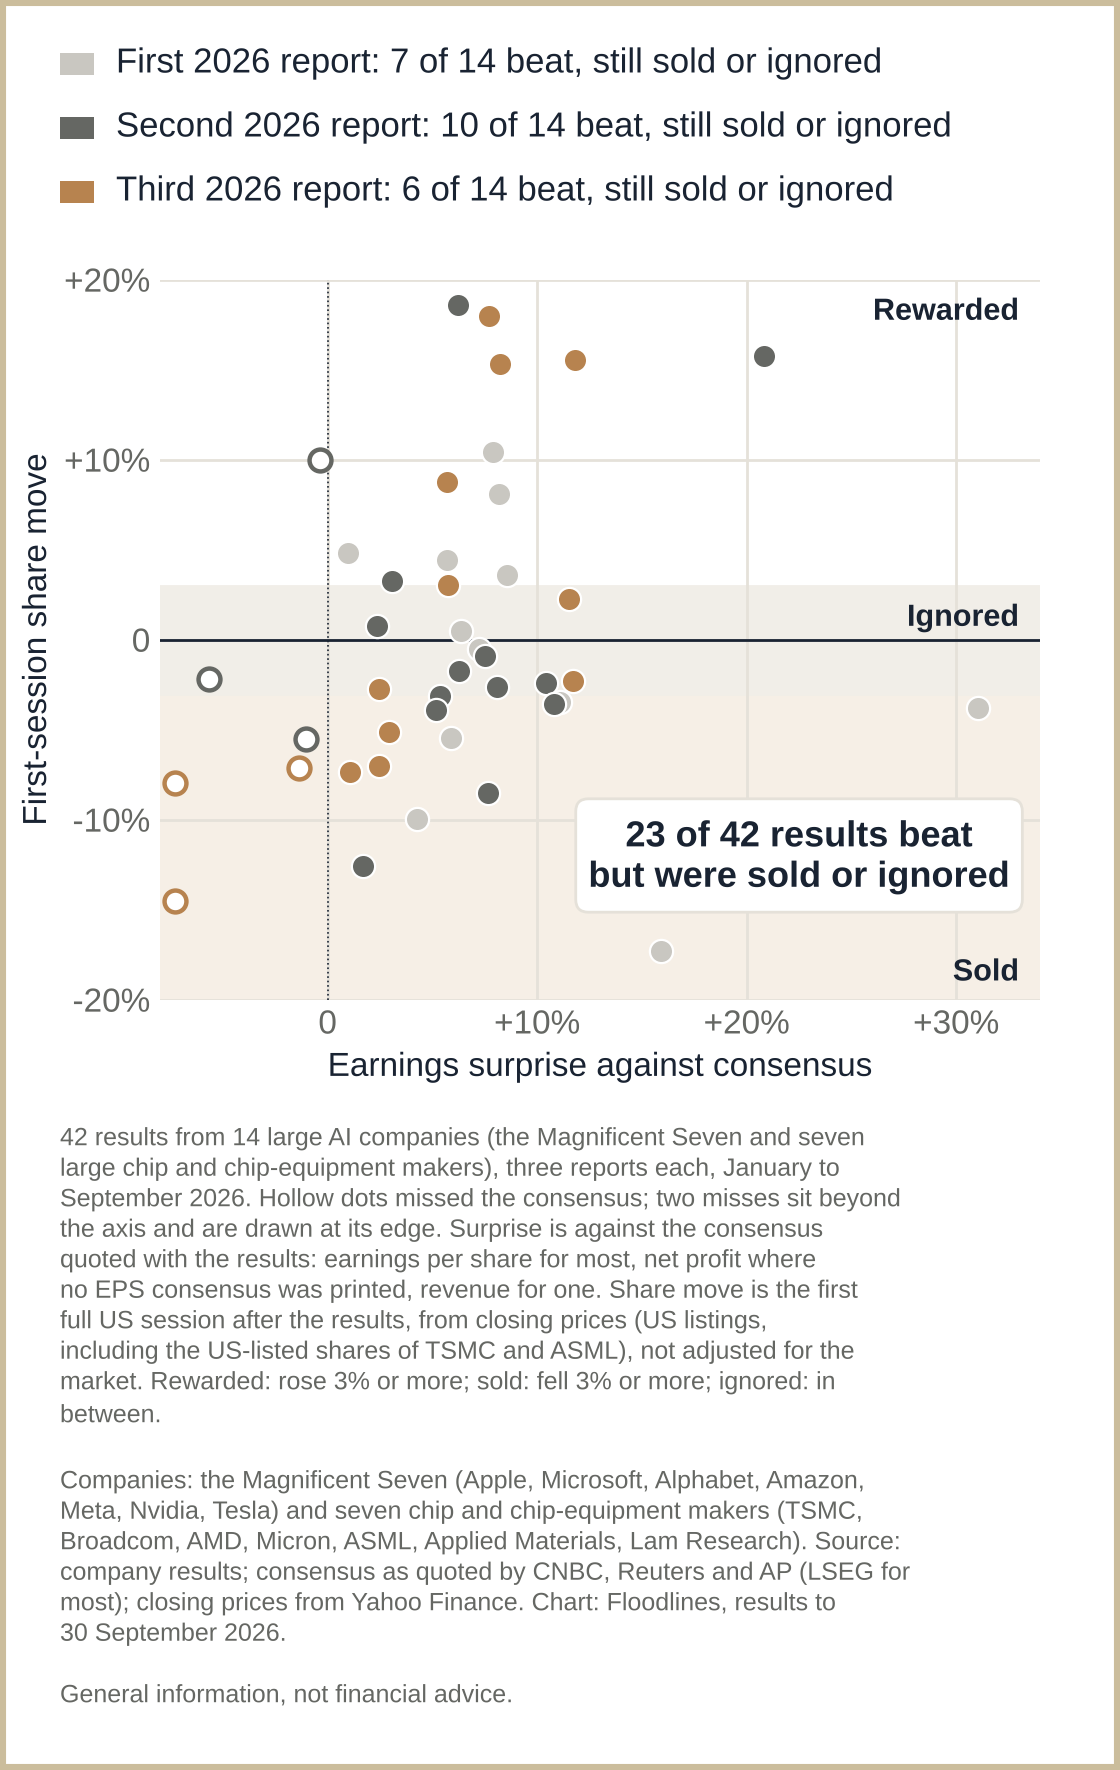
* Rewarded: the shares rose 3% or more in the first full session after the results. Sold: they fell 3% or more. Ignored: anything in between.
My reading: the upcoming results season is a key test of the market's temperature on chips, and after the OpenAI news markets could stay stringent. But as long as these companies keep growing at a healthy pace, with rising profitability and positive free cash flow, we are still in the growth stage of the AI cycle.
The tide
America's problem is funding its economy at an affordable cost. Lenders still show up at the auctions, but this month they have charged the highest price for the wait since 2014. Oil makes the overall cost to the economy higher still, and elevated bond yields leave the Fed between a rock and a hard place. AI is still driving growth expectations and so far barely shows in the inflation prints, but a high bar for reward could break the link between healthy earnings and share price reactions. On top of that, elevated yields lift AI's cost of capital, making the wait for its payday more expensive. I expect a bumpier road ahead, but I still think AI should be judged with less inflation fear in mind. Leaning. That changes if the bond market's inflation expectations start a sustained climb. I'm watching the year's final results season as the test of whether healthy earnings still get rewarded.
The week as a test
| When (Sydney) | What | Last time | What it decides |
|---|---|---|---|
| Wed 14 Oct, 23:30 | US CPI, September | August 3.4%, core 2.4%; expected 3.7%, core 2.5% (Reuters poll) | Oil alone, or broader inflation? |
| From Wed 14 Oct | AI results season opens | 36 of 42 beat; 13 rewarded | Does last week's doubt spread? |
| Thu 29 Oct, 05:00 | The Fed's decision | 16 September: up 25bps | The future rate path |
SourcesShow all 17Hide
- The week ahead: BLS release schedule (CPI, 14 October, 08:30 ET); September CPI expectations from a Reuters poll, 9 October (headline 3.7%, core 2.5% over the year), via Reuters' week-ahead report; August CPI from the BLS release of 11 September (below); Federal Reserve meeting calendar.
- Treasury nominal yields via FRED (DGS10), real yields (DFII10) and breakeven inflation (T10YIE): 4.18%, 1.93% and 2.25% on 31 December 2025; 5.24%, 2.91% and 2.33% on Friday 9 October (nominal and real from the U.S. Treasury daily par and real yield curves, the same constant-maturity yields FRED republishes a day later; breakeven from FRED T10YIE). The breakeven is the 10-year yield minus the real yield, so the lines add up by construction. Over the week to 9 October the 10-year fell from 5.28% (2 October) to 5.24%. Highs: before 28 September 2026 the 10-year last closed at or above 5.24% on 12 June 2007 (5.26%); its 2026 high so far is 5.31% (5 October). Before 29 September 2026 the real yield was last at or above 2.91% on 24 November 2008 (3.11%); its 2026 high so far is 2.95% (5 October) (FRED DGS10 and DFII10, full histories).
- Federal Reserve Bank of New York, ACM term premium (daily workbook, read 10 and 11 October; 8 October is the latest published reading): 10-year term premium 0.748% on 31 December 2025, 0.666% on 16 September, 0.985% on 7 October (the highest since June 2014) and 0.920% on 8 October. From 31 December 2025 to 8 October the term premium rose 17bps, the model's fitted 10-year 97bps and the expected short-rate path 80bps; from 16 September to 8 October the term premium rose 25bps and the fitted 10-year 23bps, with the expected short-rate path little changed.
- Debt: debt held by the public US$32,454.1bn on 8 October (U.S. Treasury, Debt to the Penny) against nominal GDP of US$32,563.0bn at an annual rate in the second quarter (BEA via FRED); the Congressional Budget Office estimates 100% of GDP at the end of fiscal 2026 (Monthly Budget Review, September 2026, as reported by the American Action Forum, 8 October).
- U.S. Treasury, auction results, 7 October 2026: 10-year note (reopening, CUSIP 91282CRF0), bid-to-cover 2.77, primary dealers 2.54% of competitive awards. Against earlier auctions: Floodlines count from TreasuryDirect auction results, 215 regular ten-year auctions since January 2009 (one off-cycle record of 21 June 2019 excluded), the lowest dealer share in the set.
- The Fed: Federal Reserve statements of 17 September 2025 and 29 October 2025 (rate cuts, the second to a range of 3.75% to 4.00%) and of 16 September 2026 (a 25bps rise, back to 3.75% to 4.00%); Reuters via Honolulu Star-Advertiser, 29 July: three dissents in favour of a hike at the July meeting. Oil: EIA Brent spot price via FRED (DCOILBRENTEU), US$91.95 on 29 July and US$127.84 on 16 September, the day of the hike (+39%); this is the spot price for prompt delivery, not the futures price in the week chart.
- CPI: BLS, August 2026 CPI release: headline CPI 3.4% over the year in August, 4.2% in May and 2.4% in February; energy's contribution rose from about 0.0 to 1.1 percentage points from February to August, more than the whole rise, while core inflation was flat (2.46% and 2.45%). A year earlier energy added about 0.2 points (September 2025). Floodlines calculation from BLS releases. Chart: Floodlines estimate from BLS CPI-U 12-month changes; core and food weighted at 79.8% and 13.9%, energy the remainder. It matches the exact August 2026 energy contribution (1.07 points) from BLS relative importance.
- Federal Reserve, minutes of the 15 to 16 September 2026 meeting, released 7 October: several participants on core goods prices and the AI build-out; the staff on technology-related consumer goods prices, one of three causes it gave for higher inflation.
- 8 October and the week to 9 October (chart and text), US closes: Nasdaq Composite via FRED (NASDAQCOM) 27,538.69 to 27,193.34 on 8 October (-1.25%) and 27,190.86 to 27,366.17 over the week (+0.6%); S&P 500 via FRED (SP500) 7,722.72 to 7,811.54 over the week (+1.2%); PHLX Semiconductor Sector Index closes (Nasdaq) 13,217.82 to 13,066.15 on 7 October (-1.1%) and 13,066.15 to 12,623.71 on 8 October (-3.4%, 2.7 times the Nasdaq's fall) and 13,136.67 to 12,572.42 over the week (-4.3%); Brent front-month futures settlements US$102.25 on 2 October and US$104.72 on 9 October (+2.4%; PFL Petroleum, 2 October and 9 October). Reuters via Virginia Business, 8 October: chipmakers were "clear underperformers" after a Financial Times report on OpenAI's revenue.
- The report on OpenAI's revenue: the Financial Times, 8 October, as reported by Reuters. Reuters first said it could not independently verify the report, then updated its story later that day, citing its own source; per Reuters, the gap from the earlier figure arose mainly from a comparison with a rival that counts revenue from sales through cloud partners, which OpenAI does not. The earlier, more upbeat figure: Axios and Reuters, 29 September.
- Earlier AI scares: on 27 January 2025 the Nasdaq Composite fell from 19,954.30 to 19,341.83 (-3.1%, FRED NASDAQCOM); the semiconductor index's 9.2% fall and the cause from Reuters (Caroline Valetkevitch) via AAP in The Courier, 28 January 2025: "Nasdaq drops as DeepSeek AI model hits tech shares". "Several": Floodlines count of falls of 1.5% or more in the Nasdaq Composite (FRED NASDAQCOM) on AI news with no other big news that day, January 2025 to February 2026 (four).
- Growth: US Bureau of Economic Analysis, GDP (third estimate), second quarter 2026, 30 September 2026: information-processing equipment and software contributed 0.75 of a percentage point a year to real GDP growth over the four quarters to June (Floodlines average of BEA's quarterly contributions), against growth of 2.2%. AI-led investment named as a support to growth by the OECD (Interim Economic Outlook, 23 September 2026) and the IMF (World Economic Outlook Update, 8 July 2026), as reported.
- Company borrowing costs: Floodlines analysis of daily US investment-grade and high-yield corporate bond spread indices, via FRED, against the 10-year Treasury yield, 16 September to 8 October 2026. The index figures are not reproduced, under the index provider's terms.
- Results chart: 42 results, three each from 14 large AI companies chosen by Floodlines, January to September 2026, listed here to disclose the method: Apple, Microsoft, Alphabet, Amazon, Meta, Nvidia, Tesla, TSMC, Broadcom, AMD, ASML, Micron, Applied Materials and Lam Research. Earnings per share from each company's results; surprise is Floodlines' calculation against the consensus quoted with the results by CNBC, Reuters or AP (LSEG for most), on the basis that consensus uses; net profit where no EPS consensus was printed, revenue for one. Share moves are first full US sessions after the results, calculated from closing prices from Yahoo Finance (US listings; TSMC and ASML through their US shares). Not adjusted for the market; a small sample. Results to 30 September 2026; share moves to 1 October. Per-result data: Floodlines.
- Computers and phones: BLS, August 2026 CPI release, Table 2: information technology commodities (computers, peripherals and smart home assistants; computer software and accessories; telephone hardware, calculators and other consumer information items) carry 0.750% of the CPI-U basket (relative importance, July 2026).
- Wages: production and non-supervisory workers' average hourly earnings, 3.72% to 3.30% over the year, February to August 2026 (FRED AHETPI); past oil shocks from FRED CPI, core CPI and WTI series, Floodlines calculation.
- Consols: Journal of the Staple Inn Actuarial Society 20(3), 1973, pp. 216 to 232: £1,000 in 2.5% Consols at the end of 1947, gross income reinvested each year-end, worth £921 in money and £365 in 1947 pounds at the end of 1970. Consols yield: Bank of England, A millennium of macroeconomic data, sheet M10 (2.5% Consols, monthly average): 2.50% in May 1946, 3.01% in December 1947. Prices rose about 4% a year, 1947 to 1970, and the cash line: ONS long-run composite price index (CDKO), annual averages. Devaluations and Bank Rate: Bank of England. Gilts were sold by tender and on tap in these years; there were no gilt auctions before 1987. Exchange control: wartime controls from 1939 were put on a permanent footing by the Exchange Control Act 1947, in force from 1 October 1947; controls were abolished on 24 October 1979 (announced 23 October 1979, UK National Archives). Calculations and chart: Floodlines.
Currency: oil is in US dollars a barrel. Index changes exclude dividends. Yields are in percent; changes are in basis points (bps), with 100bps equal to one percentage point.
Company, index and benchmark names are trade marks of their owners and are used only to identify the companies, indices and benchmarks concerned. No company, index owner, benchmark administrator or data publisher named here sponsors or endorses Floodlines.
Important information
Important. Floodlines publishes independent research and commentary on the economy, markets, industries and supply chains. It is general information only. Floodlines is not licensed to provide financial product advice and does not provide it. Nothing here is a recommendation to buy, hold or sell any financial product. Nothing here has been prepared by reference to any reader’s objectives, financial situation or needs, and Floodlines does not respond to individual questions about personal circumstances, holdings or portfolios. Views are the author’s own as at the date of publication, may change without notice, and may be wrong. Where a piece says how sure the author is of a view, or what would change her mind, that describes her confidence in her own reading of events. It is not an instruction to any reader. Before making any financial decision, obtain advice from a licensed financial adviser and consider the relevant product disclosure statement or offer document. Where a piece reports the author’s past calls, it is a record of her own process, wrong calls included. Past calls are not an indicator of future performance.
Interests. No company in this piece is discussed as an investment. OpenAI and DeepSeek are named as the subjects of news reports; neither is listed, and the author holds no position in either. Fourteen listed companies are named in the Sources and on the results chart only to disclose its method; the chart shows them as a group, and shows their share moves after results only as a measure of how the market received them. The author holds no position in any of the fourteen, in any technology, semiconductor, AI or Nasdaq-100 fund, or in US interest-rate futures or options, and no short position in US Treasuries. Other companies appear only as sources of news and data. The indices, the Brent oil prices, government bond yields and corporate bond spreads are used only as measures of markets. Floodlines receives no payment from any issuer, index owner, underwriter or dealer in connection with anything discussed.
United States readers. Floodlines is a publication of general and regular circulation. It provides impersonal commentary only, does not provide personalised investment advice, does not hold itself out as an investment adviser, and is not registered as an investment adviser with the SEC or any state. Floodlines will not answer questions about your portfolio or circumstances. Floodlines receives no compensation from any issuer, underwriter or dealer in respect of any security discussed.