Cry me a river: the US midterms
Floodlines · Anna Wu · 5 November 2026 · 5 min read
By the time you read this, control of Congress is largely settled. It's a blue sweep, and no one is surprised.
History says a midterm loss seldom ties a president's hands. Since 1946, 4 presidents lost both chambers and kept governing with tools that need no vote. Tariffs are one of them: Reagan, Trump and Biden all raised them after losing seats. In my view, with Congress shut, it could cost the economy more.
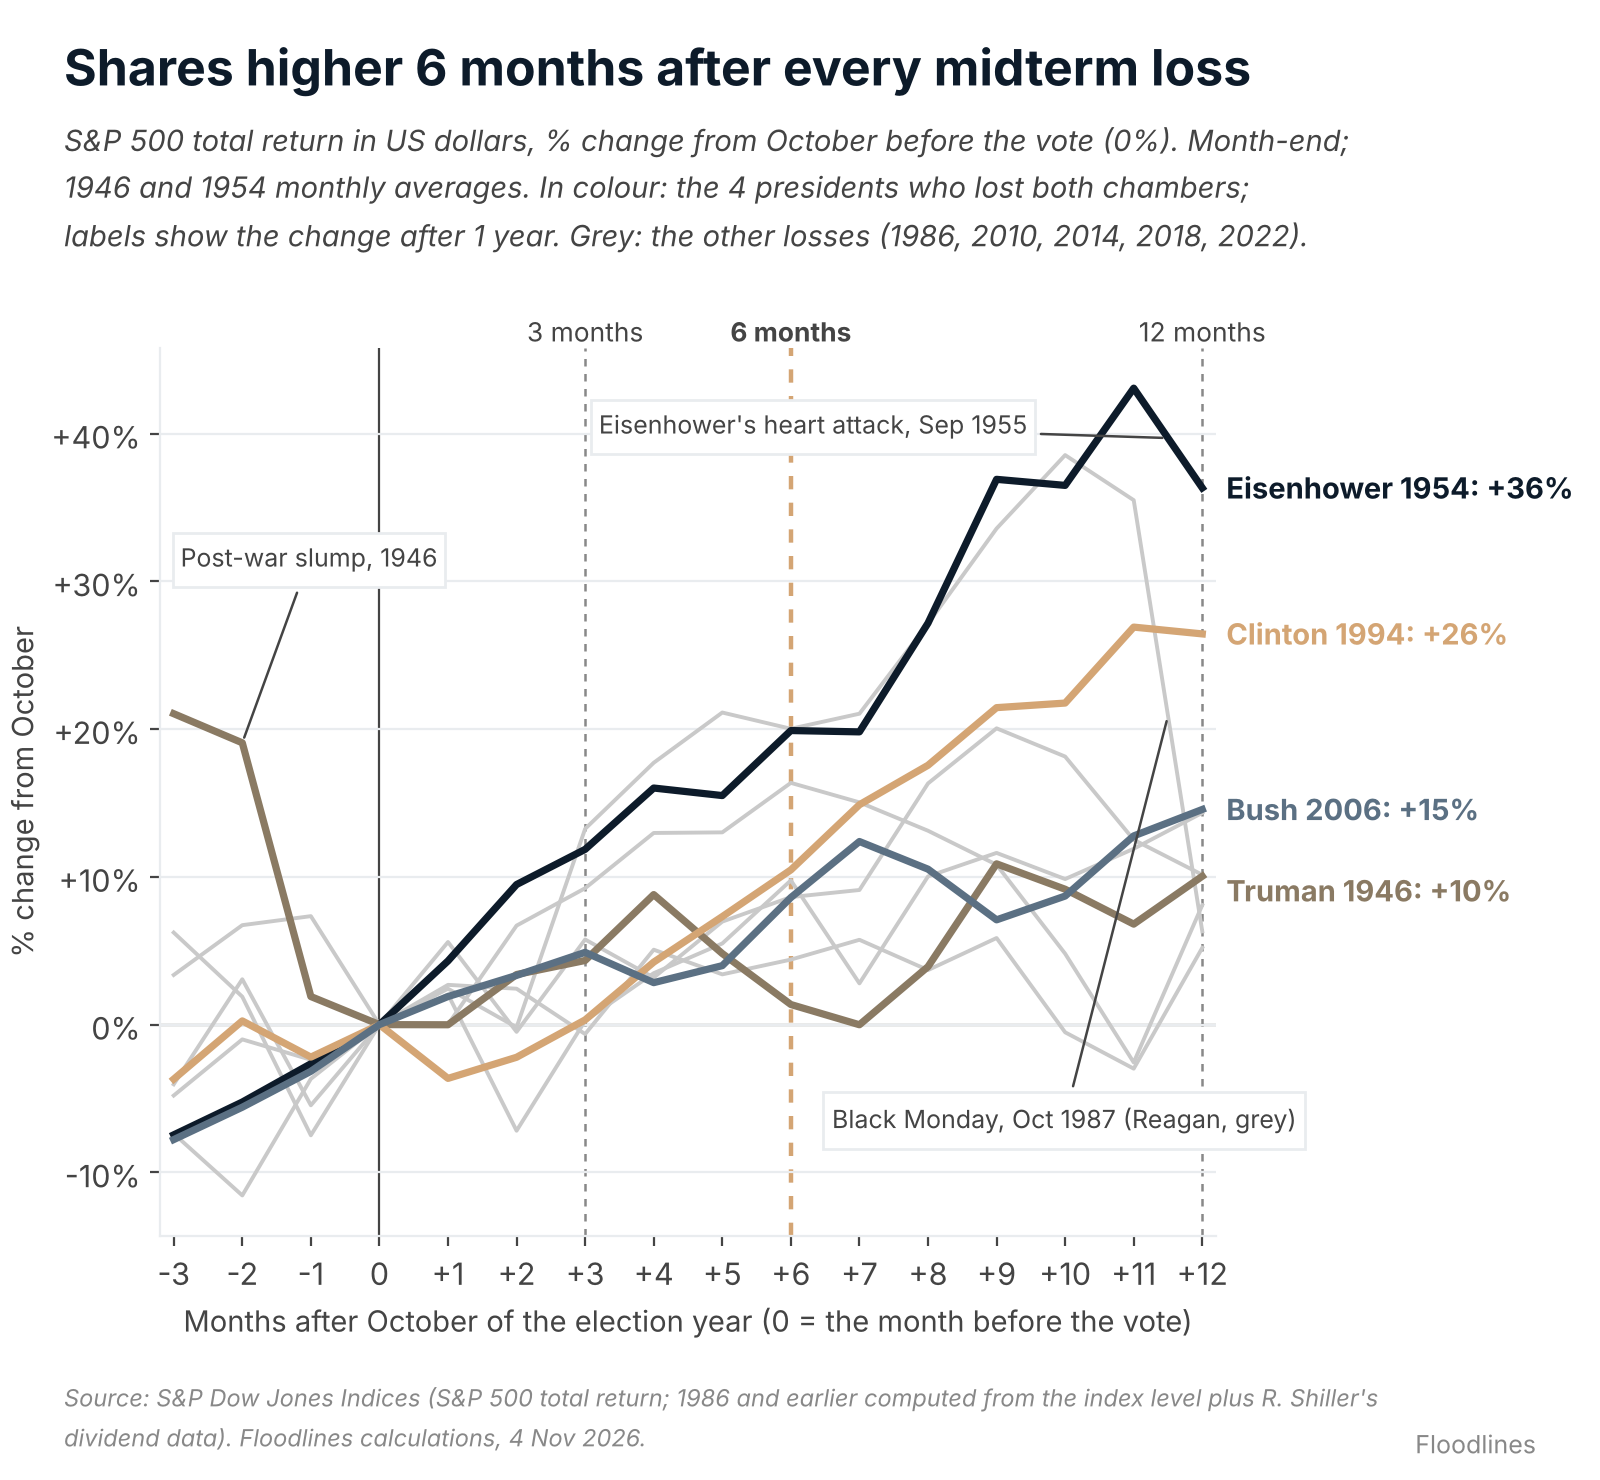
However, when the tool was a tariff, there was a victim. It is not the stock market: shares were higher 6 months after every midterm since 1946 in which the president's party lost a chamber. It is the American household, which pays the toll.
This Floodlines piece is free to read. For more like it, upgrade to a paid subscription.
Blue, but not blue enough
It was a sweep. Democrats have 54 Senate seats called, after taking 7 Republican seats, including Texas, Ohio, Kansas and Maine; Mississippi was still too close to call. In the House, Democrats are projected to win about 258 seats, some 44 more than before the vote. That is a 2018-sized House wave and a Senate gain bigger than 2006's.
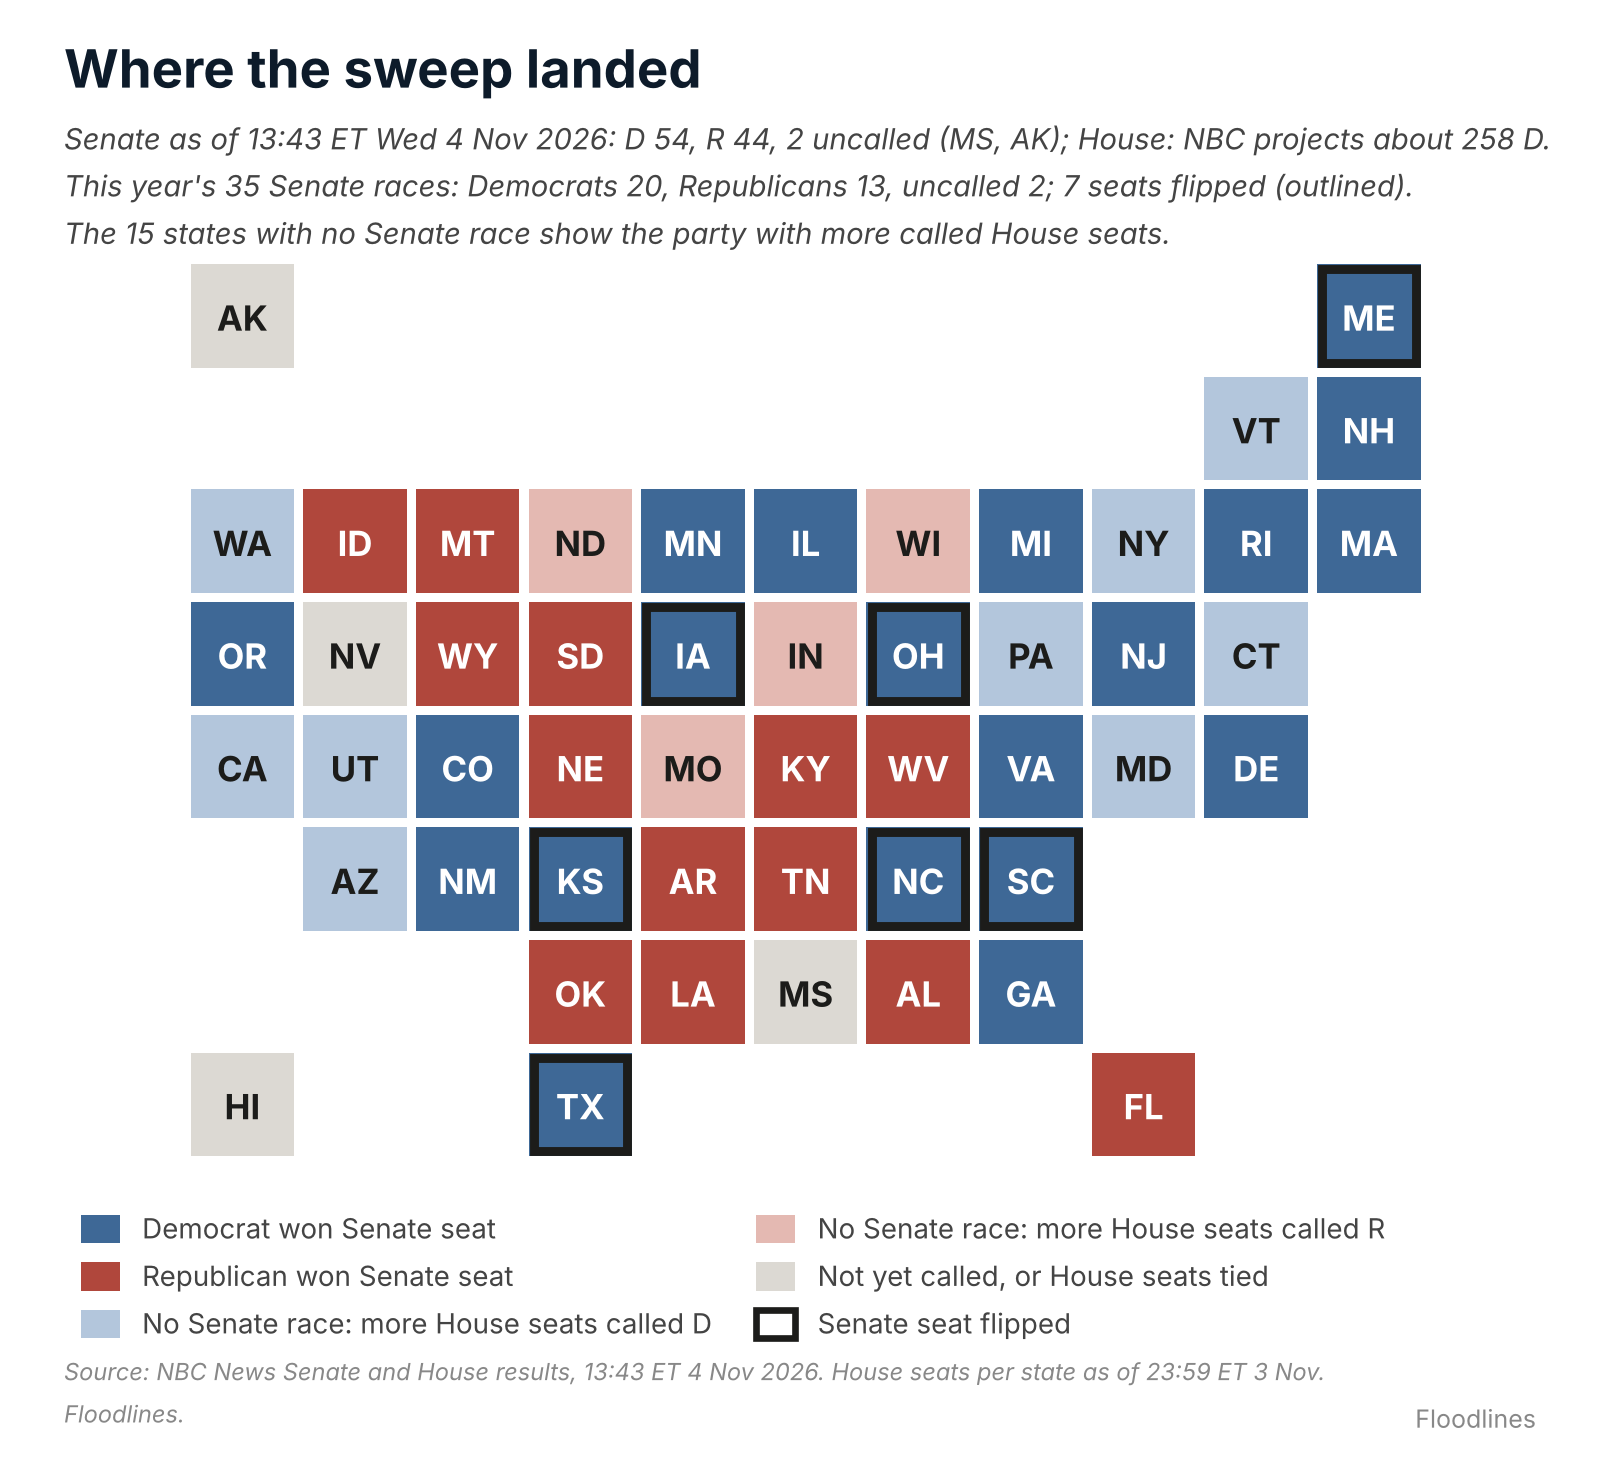
States with a Senate race are coloured by the called winner; the rest by the party with more called House seats; grey where uncalled; flips outlined. A state map overstates rural area. Counts: NBC, 23:59 US Eastern, 3 November.
What it means for America now
A midterm loss is normal: the president's party has lost seats in almost every one. A sweep is rarer. Only 4 times since 1946 has one vote flipped a one-party government in both chambers. What matters more is the margin, because a simple majority is very different from a sweeping one. Each threshold hands Congress a different legal lever.
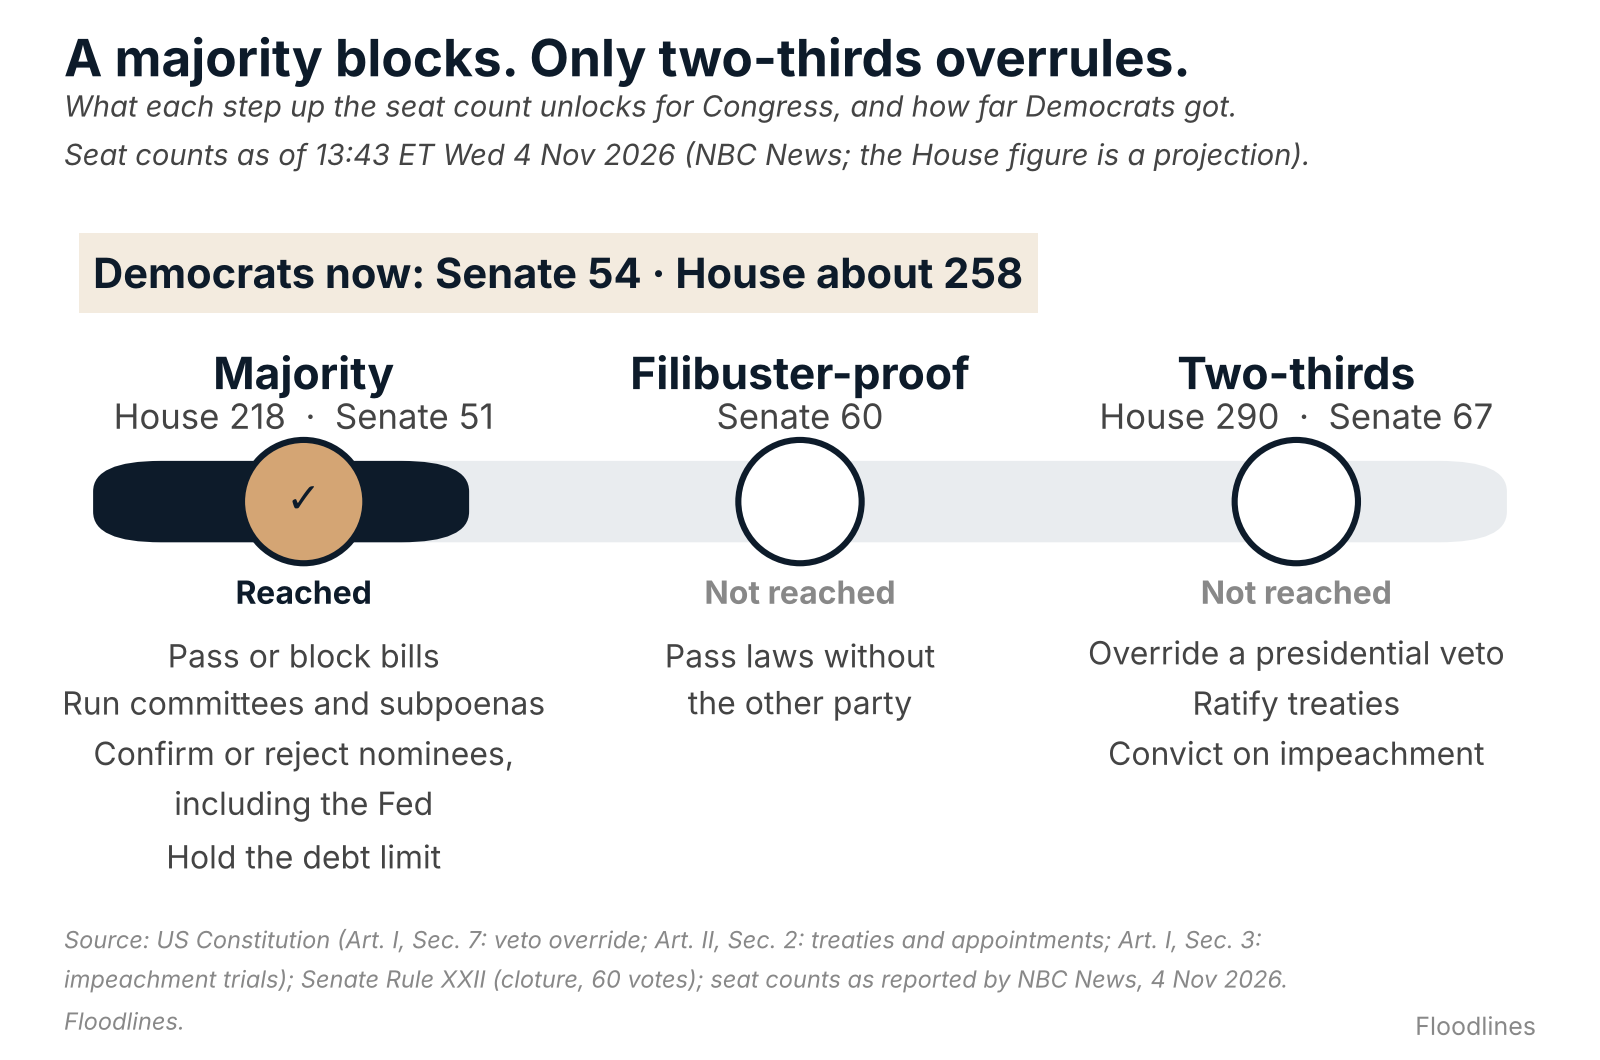
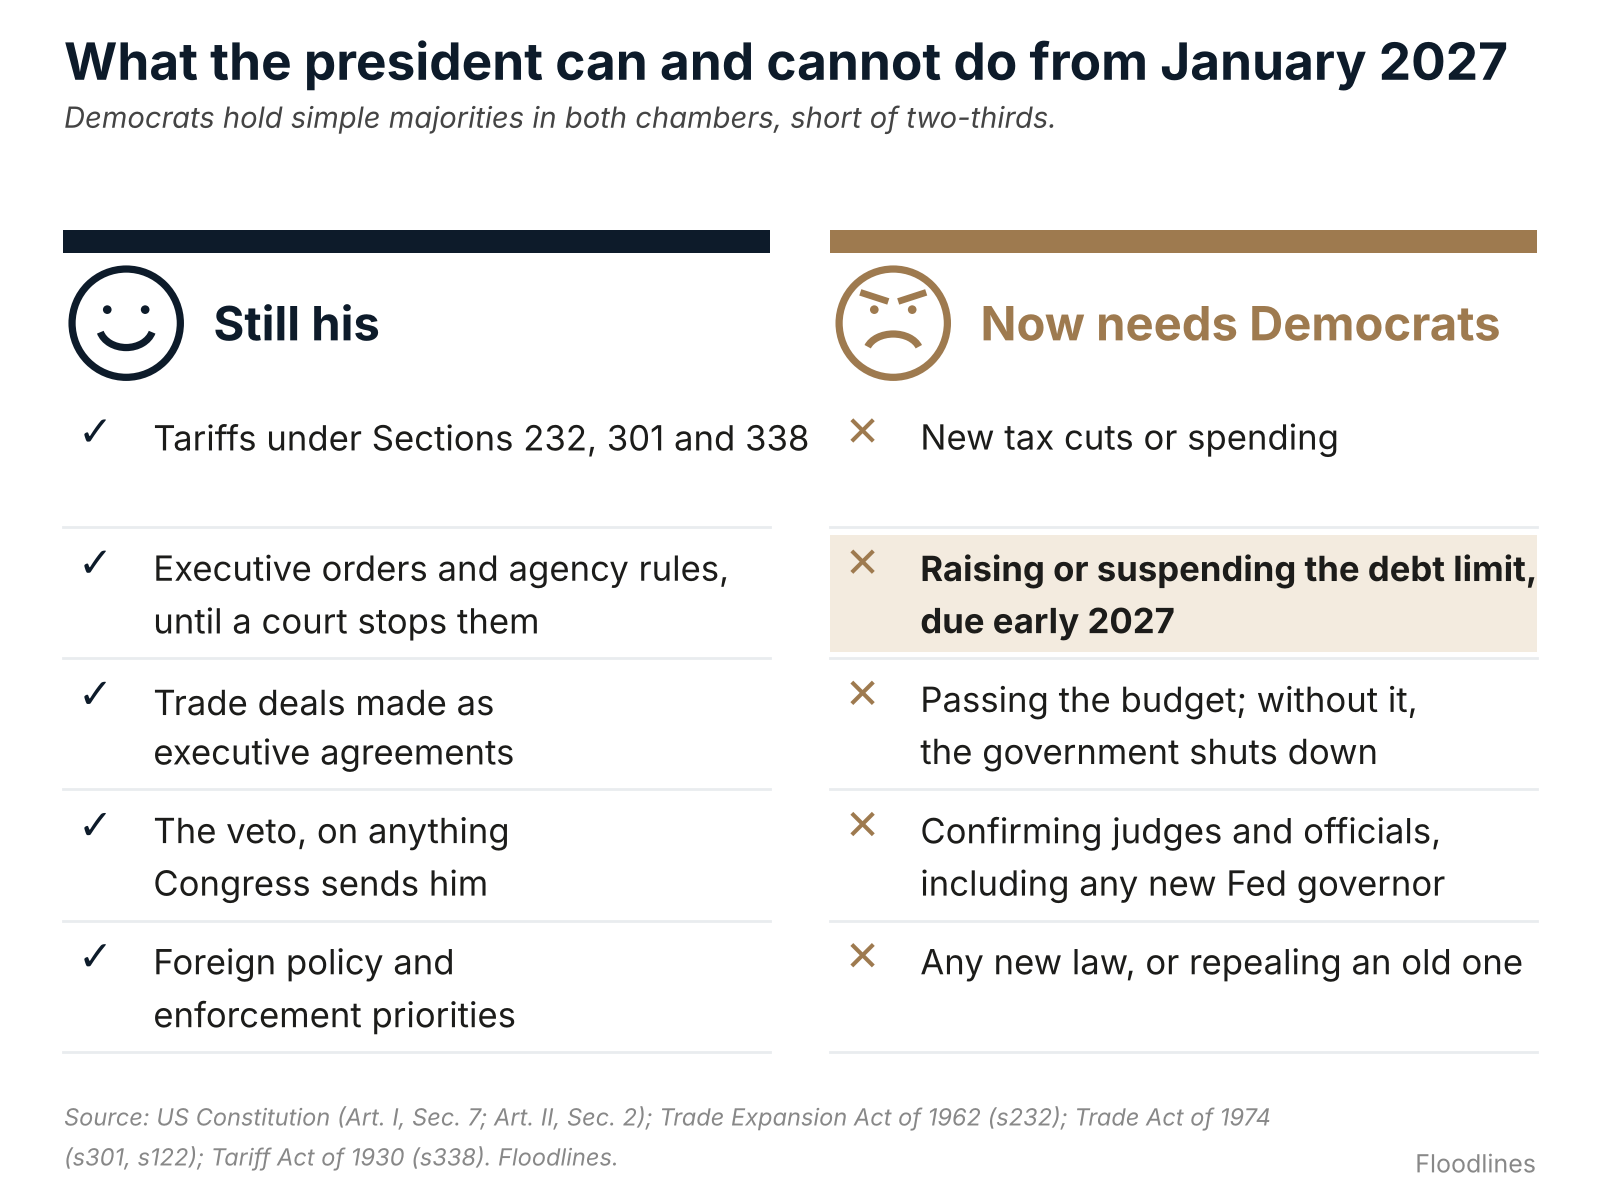
This time, Democrats hold a simple majority (the first stage in the chart above), not a supermajority. That leaves the White House more room than the headlines suggest. In other words, Trump keeps his favourite tools, executive orders and tariffs under the 3 trade laws, and his veto. Overriding it takes two-thirds of both chambers, far beyond this majority. So from a policy-making standpoint, little changes. From January, any new law, from a tax bill to the debt-limit rise due early 2027, needs Democratic votes, which gives them a brake and a bargaining chip. Reversing what is already in place is unlikely.
How the market took it
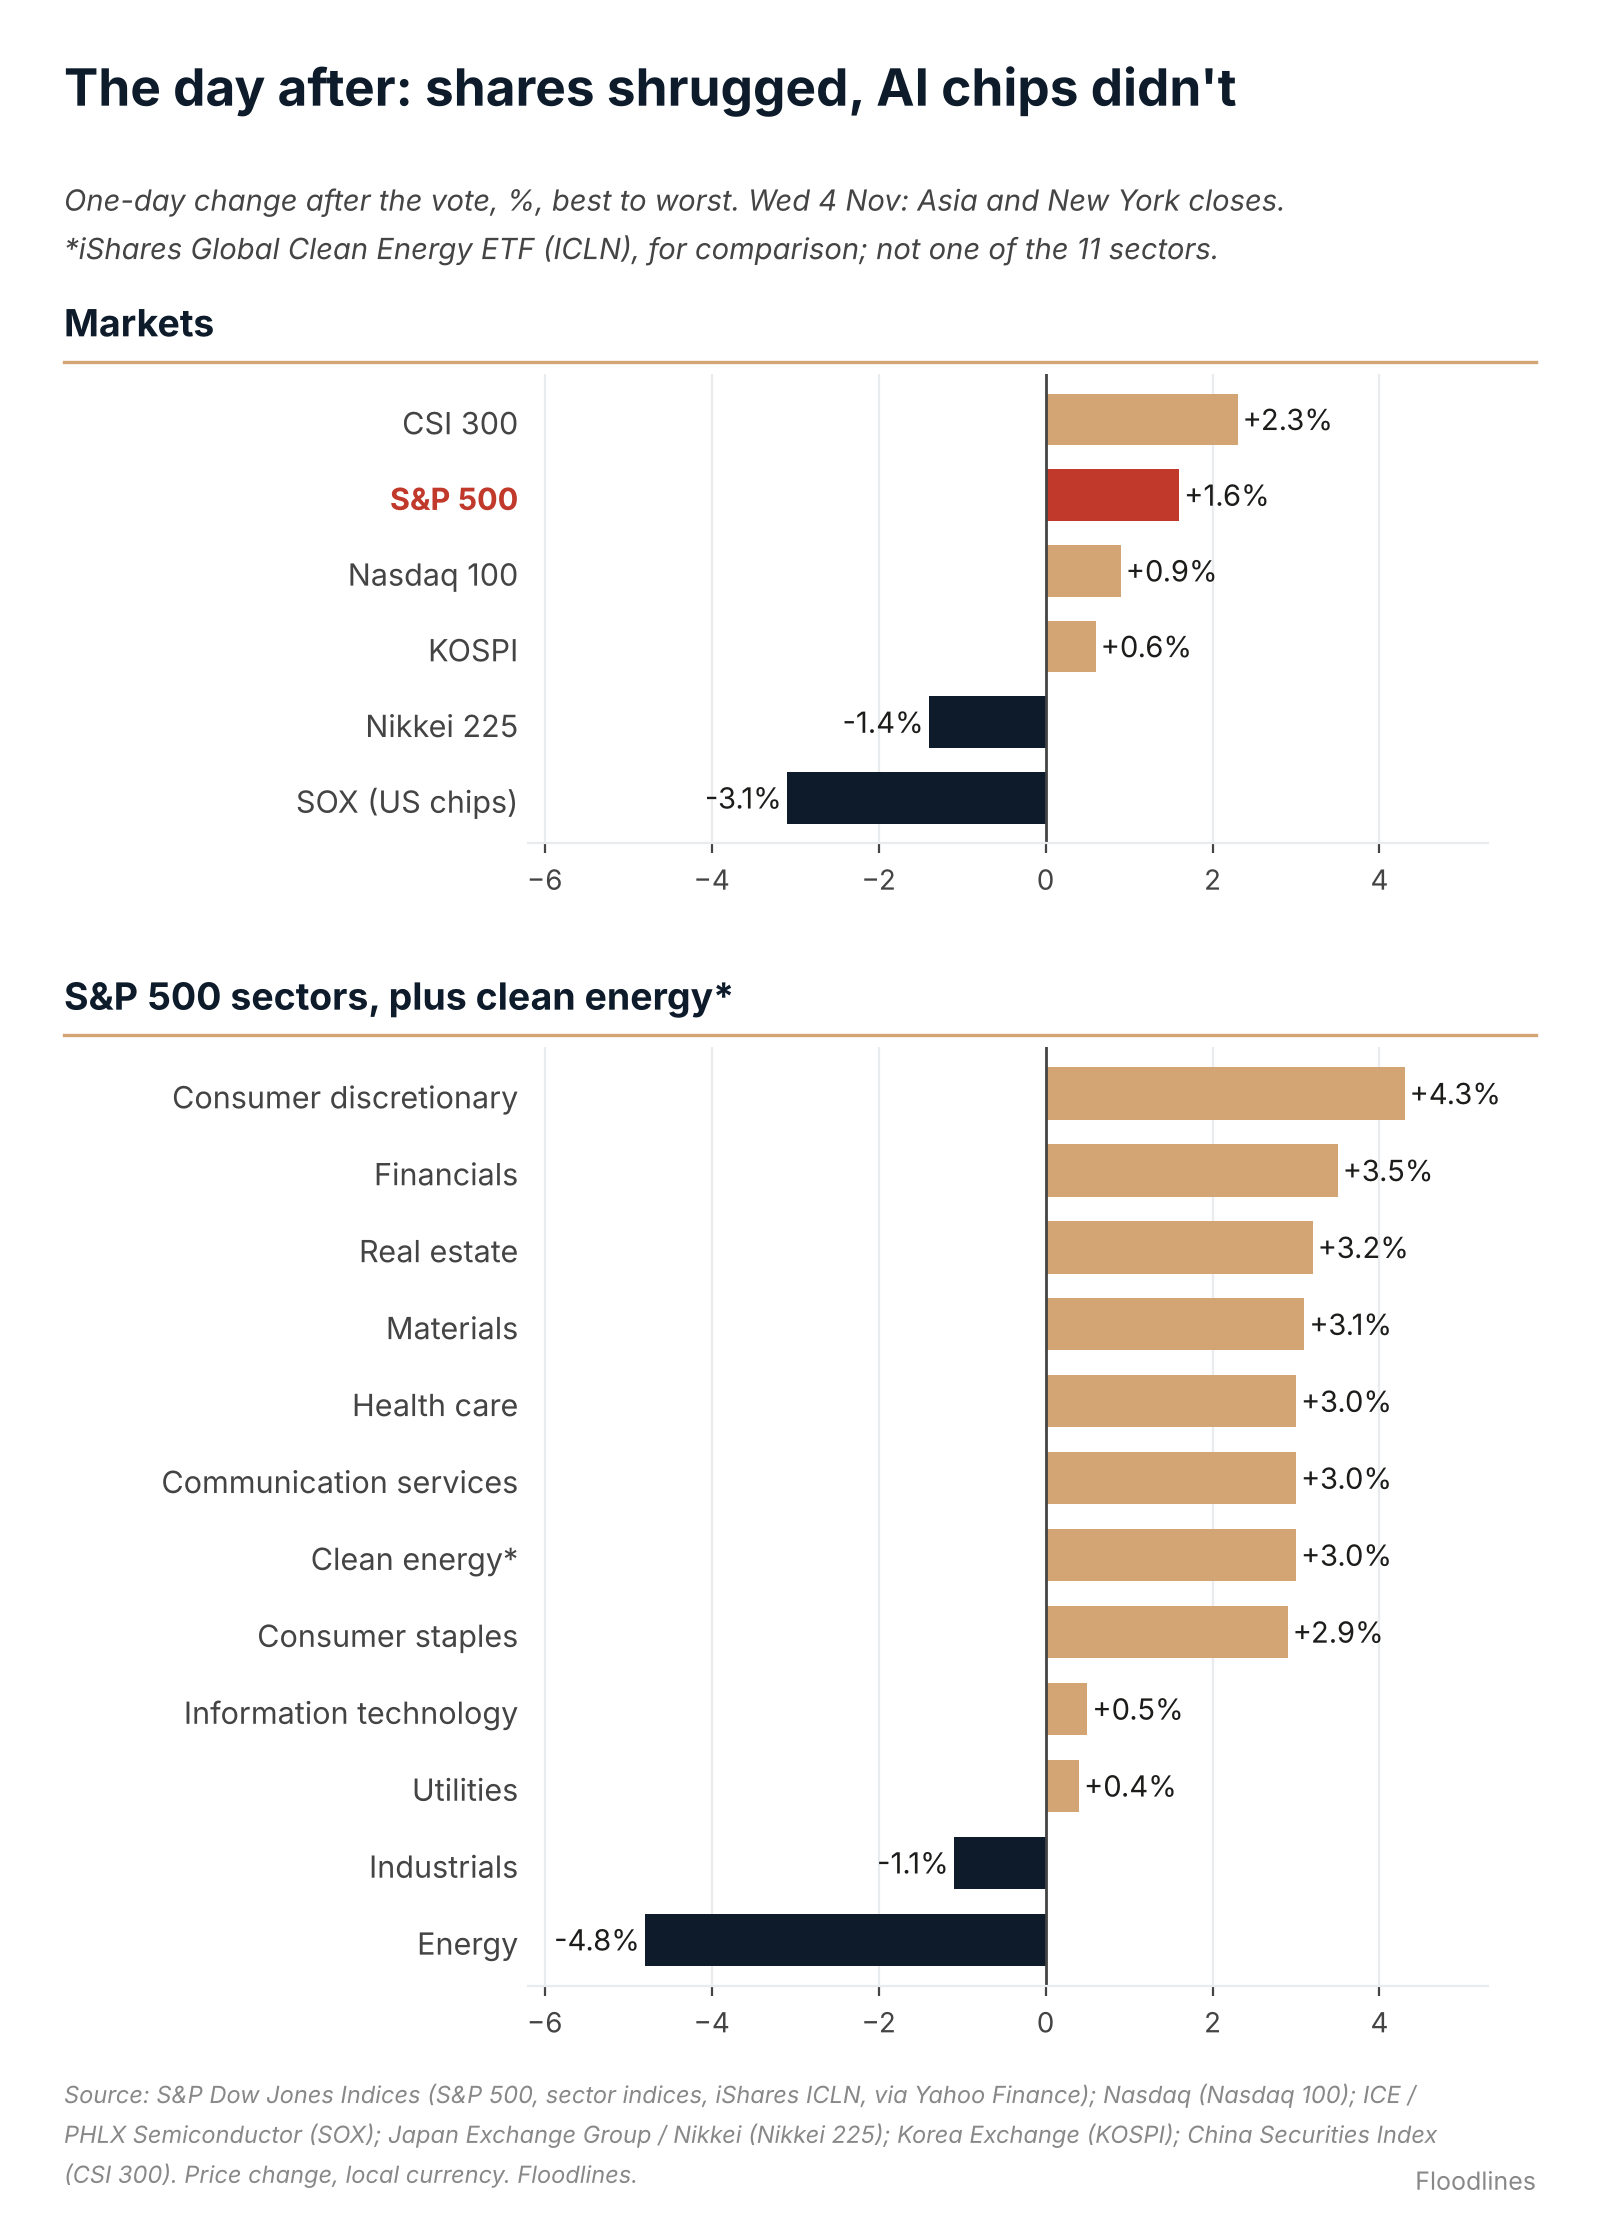
Overall, the selling did not last. US futures fell overnight, but by Wednesday's close in New York the S&P 500 was up 1.6% and the Nasdaq 100 0.9%. AI chips were the exception: the chip index (SOX) fell 3.1%, and energy (down 4.8%) and industrials were the only sectors in the red. Asian markets swung through the count and mostly closed higher, Korea up 0.6% and China's CSI 300 up 2.3%. Only Tokyo fell, by 1.4%, as investors dumped chip and AI stocks in a session that packed in 2 days of selling after Tuesday's holiday.
Sector-wise, it is worth noting that while energy stocks dropped overall, clean energy names stood out with clear gains (a global clean energy fund rose 3.0%, and solar 5.8%), as investors saw renewed hope in Democrats' historical support for clean energy, and in their criticism of the rising power bills that AI build-outs bring.
What to watch next
In my view, at this margin, the midterm changes little for policy from here. That's reflected in equities. Where the chip selling stuck, the AI worry runs deeper than the vote. So don't get too distracted by the midterm, or overthink what it means for equities. A few other things are more likely to move the market from here, and these are what I'll be watching:
- Nvidia's results, 17 November (US time). With sentiment on AI this weak, it is likely the last major test of AI demand this earnings season. The risk runs both ways, and the result will set the direction for AI stocks.
- US jobs report, Friday 6 November. A weak number would add a growth worry on top, and that would weigh on shares far more than the vote.
- Bond yields. The 10-year yield fell to 4.90% from Tuesday's 4.95%; if it climbs back above that, the vote's effect is gone. The 2-year, the yield most sensitive to the Fed, tracks its next decision on 9 December. Paired with weak payrolls, a falling 2-year would flag a growth worry.
- Iran and oil. Petrol is already 40% dearer than a year ago; any escalation reaches shares through inflation and rates, faster than anything Congress does.
Trump shrugs. History says markets do too
Some might worry I am being too positive. History says otherwise. To prove my point, I went back to 1946, about 80 years ago, to see how presidents who lost both chambers reacted afterwards. It turns out they did just fine, using the tools that need no vote, from executive orders to the veto, and the markets, especially equities, were up.
- Truman lost both chambers in 1946. In July 1948 he desegregated the armed forces by executive order, a change Congress had not voted for. The S&P 500 was up 1.4% 6 months after his loss, and 10.0% after a year.
- Eisenhower lost both chambers in 1954. In April 1956 he vetoed the Democratic farm bill; the House override failed, 202 to 211, and Congress passed a revised bill later that year. The S&P 500 was up 19.9% 6 months after his loss, and 36.3% after a year.
- Clinton lost both chambers in 1994. In January 1995, when a US$40bn loan-guarantee bill could not find the votes, he lent Mexico up to US$20bn from the Treasury's Exchange Stabilization Fund. The S&P 500 was up 10.5% 6 months after his loss, and 26.4% after a year.
- Bush lost both chambers in 2006, in the middle of the Iraq war: the closest match to today. In January 2007 he sent more than 20,000 extra troops to Iraq, then vetoed the bill that set a withdrawal timeline. The override failed. The S&P 500 was up 12.4% 6 months after his loss, and 14.6% after a year.
After all, a loss is no special case. The S&P 500 was higher a year after all 17 midterms since 1957.
Tariffs are a tool worth watching
Tariffs have slipped down the agenda this year. Now could be when they come back. Presidents who lost seats at a midterm have turned to tariffs before, Trump most aggressively, and he is the one in the White House.
The next test is the US-China trade truce, due to lapse on 10 November, with a potential extension to early 2027. What it decides will move equities, in the US as well as China. If tariffs rise, the cost lands twice: higher prices, on top of petrol already 40% dearer than a year ago, and slower growth, which hurts shares. When China tariffs went to 25% in May 2019, the S&P 500 fell 6.6% that month; after the tariffs of 2 April 2025, it fell 12% in 4 trading days.
Households pay when the tool is a tariff
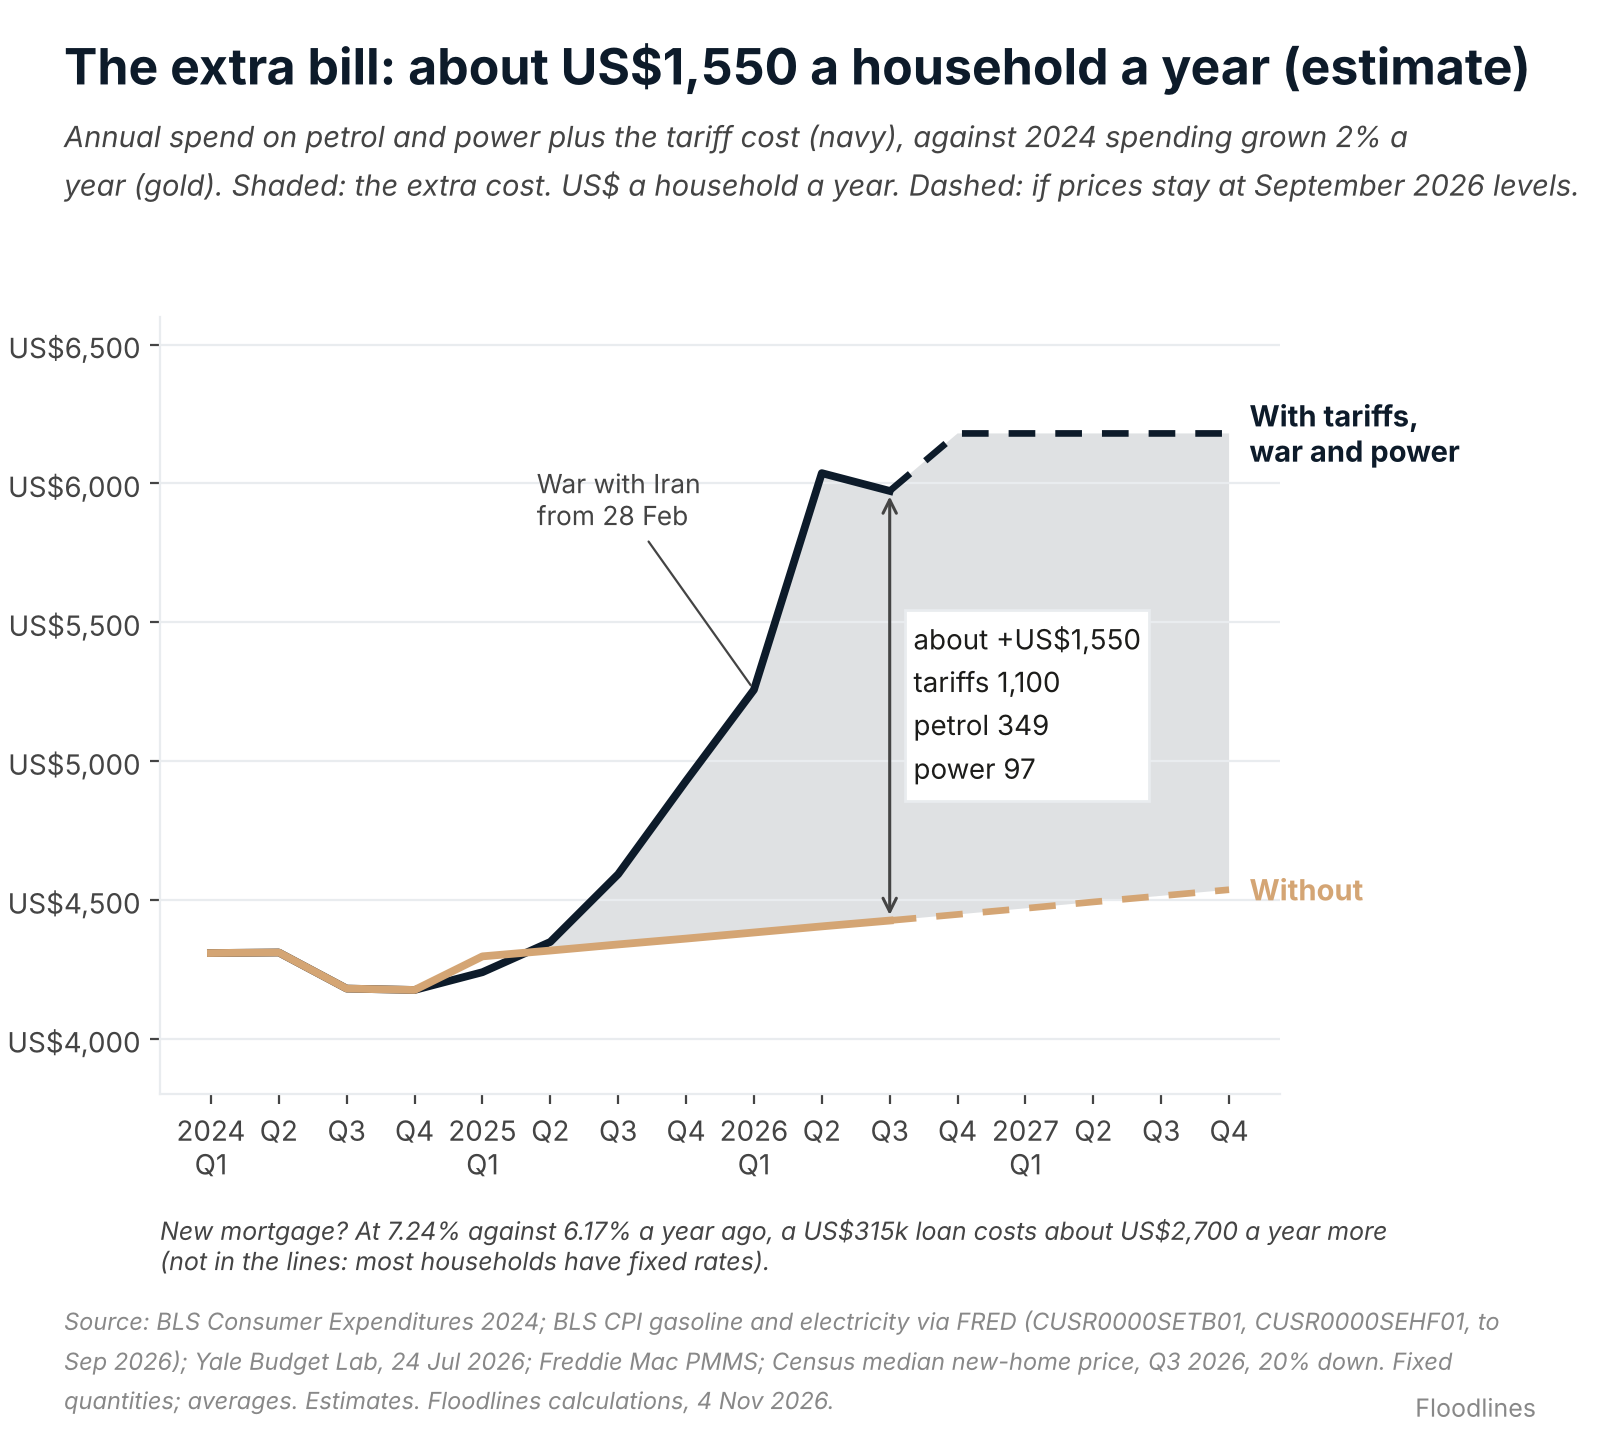
History is clear: when tariffs are the main lever, American households pay. In 2018 and 2019, US buyers paid almost all of Trump's China tariffs. Today's tariffs already cost about US$1,100 a household a year, on the Yale Budget Lab's estimate. As investors, we cannot ignore it: when consumer sentiment is already near record lows, tariffs are a headwind for consumption, and a cause of inflation. That headwind would bite harder if the AI build-out, one of the main drivers of US growth, slows.
Furthermore, tariffs are only part of the bill. American households are also paying for the US-Iran war at the pump, for power bills pushed up by data centres, and for a mortgage rate that has climbed with the Fed. Household budgets are already stretched, and a new round of tariffs would stretch them further.
Ironically, many of the voters who put Trump back in the White House now carry the heaviest share of the bill. Tariffs take the biggest bite out of lower-income households' budgets, and about half of voters from households earning under US$50,000 backed Trump in 2024.
Where does that leave us? In my view, capital wins in the end. Risk assets have looked past every lost chamber since 1946, and I expect them to look past this one. The bill lands elsewhere: on American households. And if consumption shrinks sharply, it could backfire on equities too.
SourcesShow all 19Hide
- Result and margins: NBC News House and Senate results, 13:43 US Eastern, 4 November 2026 (05:43 Sydney, 5 November); Senate calls, AP as relayed by CNBC and CBS live coverage, 3 November 2026; pre-election House, House Press Gallery party breakdown. House projection: NBC model (a projection, not a count). Historical comparisons: history.house.gov; senate.gov; Floodlines arithmetic.
- Map: per-state Senate winners, NBC News, 13:43 US Eastern, 4 November 2026; called House seats per state, 23:59 US Eastern, 3 November 2026; Floodlines chart.
- Market moves, 4 November 2026: Nikkei 225, KOSPI and CSI 300 closes (Yahoo Finance, Naver); S&P 500, Nasdaq 100, PHLX Semiconductor Index (SOX), S&P 500 sector indices and iShares Global Clean Energy ETF (ICLN), closes on 4 November (Yahoo Finance, checked against Naver); US 10-year yield, US Treasury daily par yield curve, 3 and 4 November closes; overnight futures, NBC News live blog, 01:41 US Eastern. US chip stocks before the vote: PHLX Semiconductor Index, Yahoo Finance daily closes.
- Presidents after a midterm loss: Executive Order 9981, 26 July 1948 (National Archives); Eisenhower, veto of H.R. 12 (Agricultural Act of 1956), 16 April 1956, and the House vote of 18 April 1956; Proclamation 5631, 17 April 1987; Exchange Stabilization Fund support for Mexico and joint statement with congressional leaders, 31 January 1995; President Bush, address to the nation, 10 January 2007, and veto of H.R. 1591, 1 May 2007; 84 FR 20459, 9 May 2019; presidential memorandum on Section 301 tariffs, 14 May 2024 (DCPD-202400409). Clinton's car tariffs: USTR proposal, 60 FR, 18 May 1995; agreement of 28 June 1995.
- US-China truce: White House fact sheet, 1 November 2025; Executive Order 14358; MOFCOM and General Administration of Customs announcement 2025 No. 70; MOFCOM, 28 September 2026 (extension to 10 January 2027); Federal Register search, 4 November 2026. Growth: BEA, GDP advance estimate, third quarter 2026 (29 October 2026); National Bureau of Statistics of China, 20 October 2026.
- May 2019 tariff cost per household: Mary Amiti, Stephen Redding and David Weinstein, "New China Tariffs Increase Costs to U.S. Households", Liberty Street Economics, Federal Reserve Bank of New York, 23 May 2019.
- Tariffs and prices: Yale Budget Lab, "The State of U.S. Tariffs", 24 July 2026 (about 0.7% on the price level; about US$1,100 a household); Trump's tariff rise, Yale Budget Lab, 19 January 2026 (16.9%, highest since 1932). Pay: BLS average hourly earnings, production and nonsupervisory workers, September 2026, +3.3% on a year; CPI-U +3.7%. 2024 vote by income: national exit poll (Edison Research, via the Roper Center: under US$50,000, Trump 50%, Harris 48%); Pew Research Center validated voters, 26 June 2025; tariffs regressive: Yale Budget Lab, 9 March 2026.
- Household extra-cost chart: BLS Consumer Expenditures 2024 (petrol US$2,411, electricity US$1,833 a household); BLS CPI gasoline and electricity via FRED (CUSR0000SETB01, CUSR0000SEHF01, to September 2026); Yale Budget Lab, 24 July 2026; Freddie Mac PMMS via FRED (MORTGAGE30US); Census median new-home price, Q3 2026 (MSPUS). Baseline grown 2% a year; tariff cost phased in from 2025 Q1 to 2026 Q2; 2027 holds September 2026 prices. Floodlines calculations, 4 November 2026.
- Consumer sentiment: University of Michigan index, October 2026 final 48.0, about 3 points above its all-time low.
- Tariffs and shares: S&P 500 closes, 30 April and 31 May 2019, and 2 April and 8 April 2025 (S&P Dow Jones Indices); Floodlines arithmetic.
- What to watch next: Nvidia, results date for the third quarter of fiscal 2027, 28 October 2026; US Bureau of Labor Statistics, Employment Situation release schedule; Federal Reserve, FOMC meeting calendar; US 10-year Treasury yield, Federal Reserve H.15.
- Returns and yields after a midterm loss (charts and tables; 9 cases: 1946, 1954, 1986, 1994, 2006, 2010, 2014, 2018, 2022): S&P 500 total return: S&P Dow Jones Indices (S&P 500 total return index) month-end closes via Yahoo Finance, 1994 to 2022; 1986 computed from S&P 500 month-end closes (Yahoo Finance) with Shiller dividends reinvested; 1946 and 1954 computed from Shiller monthly average prices with dividends reinvested. Election-day check: S&P 500 total return daily closes, 1994 to 2022; before 1988, S&P 500 price plus an estimated quarter of the annual dividend yield. US 10-year: Federal Reserve H.15 via FRED (DGS10 month-end, 1986 to 2022; GS10 monthly average, 1954); Shiller long government bond rate as a proxy (1946). All 17 midterms since 1957: S&P 500 closes via Yahoo Finance. Compiled by Floodlines, 4 November 2026; Floodlines arithmetic.
- Presidents after a loss: Reagan, Proclamation 5631, 17 April 1987 (Section 301). Clinton: US Treasury, Exchange Stabilization Fund support for Mexico, 31 January 1995. 2019: Federal Register, notice of modification of Section 301 action, effective 10 May 2019.
- Who paid the 2018 and 2019 tariffs: Mary Amiti, Stephen J. Redding and David E. Weinstein, "Who's Paying for the US Tariffs? A Longer-Term Perspective", AEA Papers and Proceedings 110, May 2020 (data to October 2019). Pass-through to shop prices: Alberto Cavallo, Paola Llamas and Franco Vazquez, tracking tariffs in US retail prices, Harvard Business School Pricing Lab, 30 January 2026 (retail pass-through about 24%, data to 1 October 2025).
- Tariff powers and veto override: 19 USC 1862, 2411, 1338; US Constitution, Article I, Section 7. Refunds of US$134.4bn, May to September 2026: Monthly Treasury Statement. Learning Resources, Inc. v. Trump, Supreme Court of the United States, 20 February 2026, 6 to 3 (CRS LSB11398).
- Tariff cost per household: Yale Budget Lab, "The State of U.S. Tariffs", 24 July 2026 (US$1,100). Floodlines' check (about US$1,000): the rise in US consumer prices for tariff-exposed goods above their pre-tariff trend (BLS CPI, September 2024 to September 2026), applied to US consumer spending per household (BEA, Census), and cross-checked against customs duties collected (Treasury) and studies by the New York Fed and Harvard's Pricing Lab.
- Power bills: Reuters, "Power bills and data centers cast rare spotlight on utilities in US midterms", 31 October 2026.
- Petrol: US Energy Information Administration (EIA), weekly US regular gasoline retail price, week of 26 October 2026; litre conversion and percentage change are Floodlines arithmetic. Mortgage: Freddie Mac Primary Mortgage Market Survey, 29 October 2026.
- Debt limit: Daily Treasury Statement, debt subject to limit, 29 October 2026 (headroom US$713bn).
Data attribution: S&P 500 data, S&P Dow Jones Indices; Nikkei 225, Nikkei Inc.; Treasury yields, Board of Governors of the Federal Reserve System (H.15), retrieved from FRED; long-run S&P 500 prices, dividends and bond rates, Robert J. Shiller's online data.
Currency: US dollars. Data, index and benchmark names are trade marks of their owners, used only to identify the data concerned. No data publisher named here sponsors or endorses Floodlines.
Important information
General information only. Floodlines is not licensed to provide financial product advice, and nothing here is a recommendation to buy, hold or sell. The author holds no position in any company named. Floodlines is not a registered investment adviser.
Show full termsHide full terms
Important. Floodlines publishes independent research and commentary on the economy, markets, industries and supply chains. It is general information only. Floodlines is not licensed to provide financial product advice and does not provide it. Nothing here is a recommendation to buy, hold or sell any financial product. Nothing here has been prepared by reference to any reader’s objectives, financial situation or needs, and Floodlines does not respond to individual questions about personal circumstances, holdings or portfolios. Views are the author’s own as at the date of publication, may change without notice, and may be wrong. Forecasts and estimates in this piece, including the household cost estimate, are opinions and may be wrong. Before making any financial decision, obtain advice from a licensed financial adviser and consider the relevant product disclosure statement or offer document. Past market moves, including the midterm record in this piece, are not a reliable indicator of future performance.
Interests. No company in this piece is discussed as an investment. Nvidia is named only for the date of its results, as a marker for AI demand. The author holds no position in Nvidia (shares, bonds, options or other securities), in any S&P 500, Nasdaq-100, technology or semiconductor fund, in options or futures on the indices discussed, or in US Treasuries or US government bond funds. Other organisations appear only as sources of news and data. The indices and government bond yields are used only as measures of markets. Floodlines receives no payment from any issuer, index owner, underwriter or dealer in connection with anything discussed.
United States readers. Floodlines is a publication of general and regular circulation. It provides impersonal commentary only, does not provide personalised investment advice, does not hold itself out as an investment adviser, and is not registered as an investment adviser with the SEC or any state. Floodlines will not answer questions about your portfolio or circumstances. Floodlines receives no compensation from any issuer, underwriter or dealer in respect of any security discussed.