As Halloween approaches, the market has turned spooky. Over the past two weeks, shares fell, with the damage concentrated in chips, as fears of an AI bubble and sticky inflation soured the mood. There are not many places to hide: US Treasuries still work as the classic haven, but for how long? The next time investors knock on the haven's door, will they get a trick or a treat? As I see it, there are two tricks and one treat, and the treat could turn into a trick. Let's go through them.
The week in three points
- Trick one: US Treasuries could be a haven, then a trap. Investors ran to them as equities fell, as usual, and their yields look generous this time. But yields could still climb, driven by sticky oil-led inflation, an AI build-out that could keep real yields high, and a term premium that can jump fast. In complicated times like these, I would rather be patient.
- Trick two: credit spreads could look calm, then jump-scare. Broad spreads remain below their long-term average, despite an AI credit scare. But CCC spreads, on the riskiest borrowers, are at their highest since mid-2020, and CCC blowouts have often hurt equities.
- The treat: AI-driven growth, in a sentiment costume. The build-out is adding an estimated 0.6 to 1.5 percentage points to US growth this year, and AI results have been strong. Yet sentiment soured in October and chips fell. If the gloom persists, it could spread to the broader market. This week's results from Alphabet, Microsoft and Amazon are the reality check.
Trick one: US Treasuries could be a haven, then a trap
Investors usually run to US Treasuries when shares sell off, and they did over the last two weeks as chips slid: the PHLX Semiconductor Index (SOX) fell 14% and the S&P 500 2.4% (total return). As a result, the 10-year Treasury yield fell 24 basis points (bps), lifting prices, even amid rising oil prices and inflation concerns.
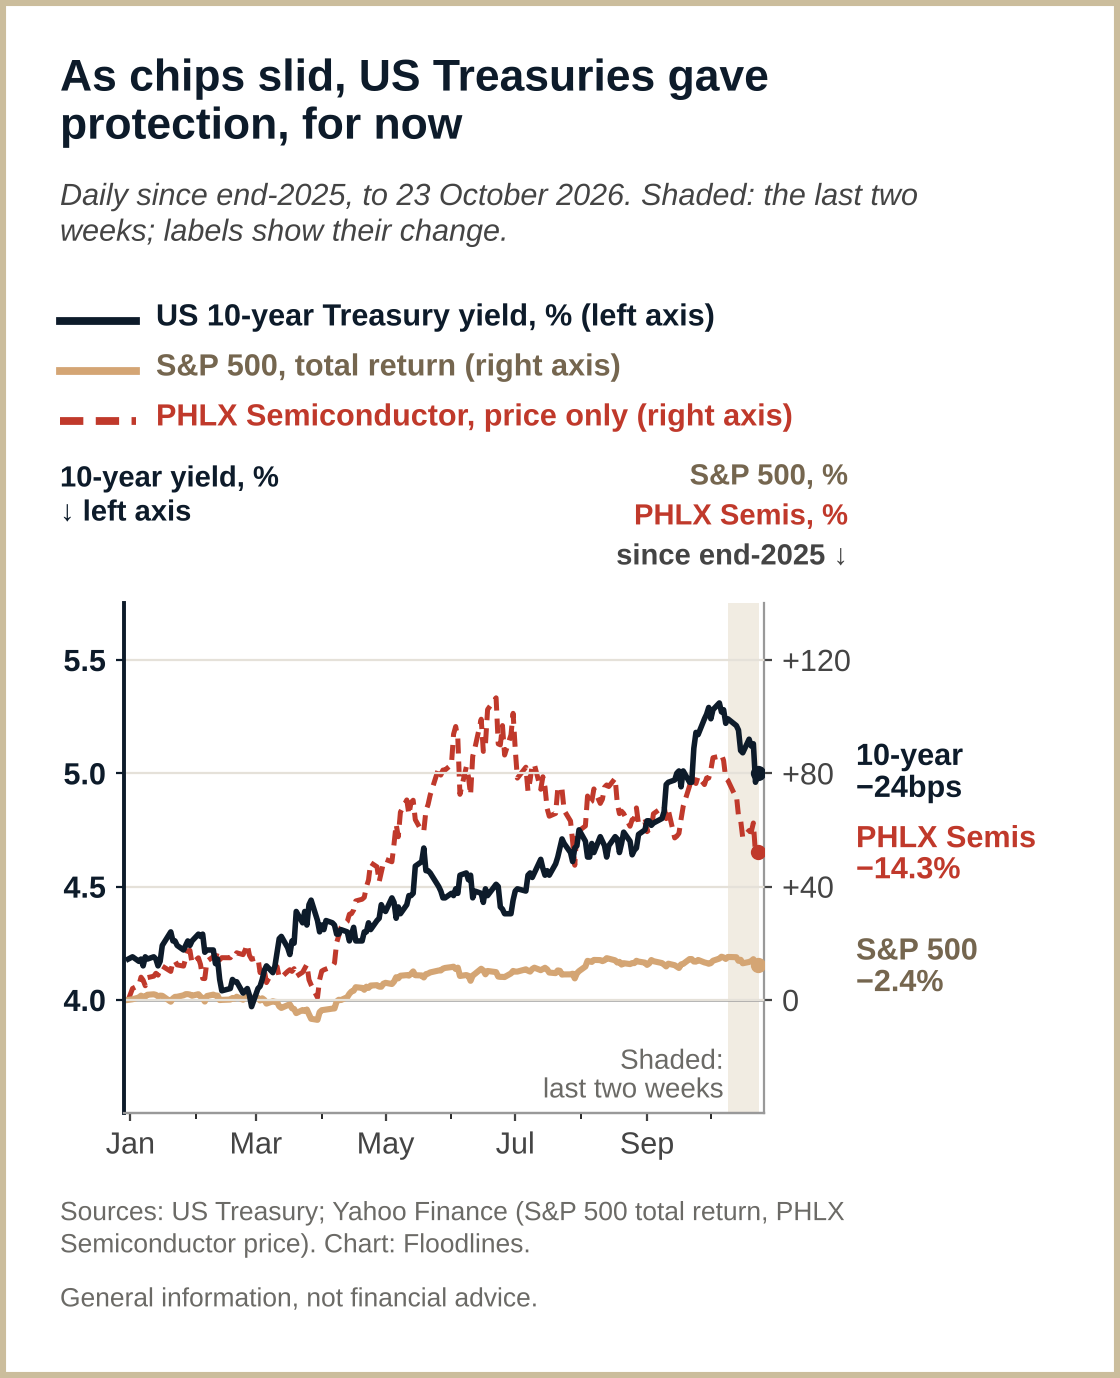
On the surface, US Treasuries look attractive, with yields still well above a year ago (by 99bps) and their 20-year average (by about 210bps). However, that could also be what a yield trap looks like: a generous yield that still leaves you behind cash, or worse, if yields keep rising.
Historically, a yield trap has been tricky to spot, especially when conditions are complex, because it can come from tighter policy (1994, when the Fed doubled its rate), a jump in the term premium (2023, after the Fed's last hike) or rising real yields (late 2024, even as the Fed cut). Today, all three are in play: sticky oil-led inflation, real yields (after inflation) that AI spending could keep high, and a term premium (the extra yield for lending longer) at its highest since 2014 in early October. Unless something changes, yields could rise from here.
My reading: right now, I cannot rule out that we are standing in front of a yield trap. Where yields go next depends on inflation, the term premium and real yields over the next couple of weeks. So I am watching the Fed's decision, the US GDP print, and how big tech's results interact with the term premium and real yields, for more clues. Until then, I would rather be patient.
Trick two: credit spreads could look calm, then jump-scare
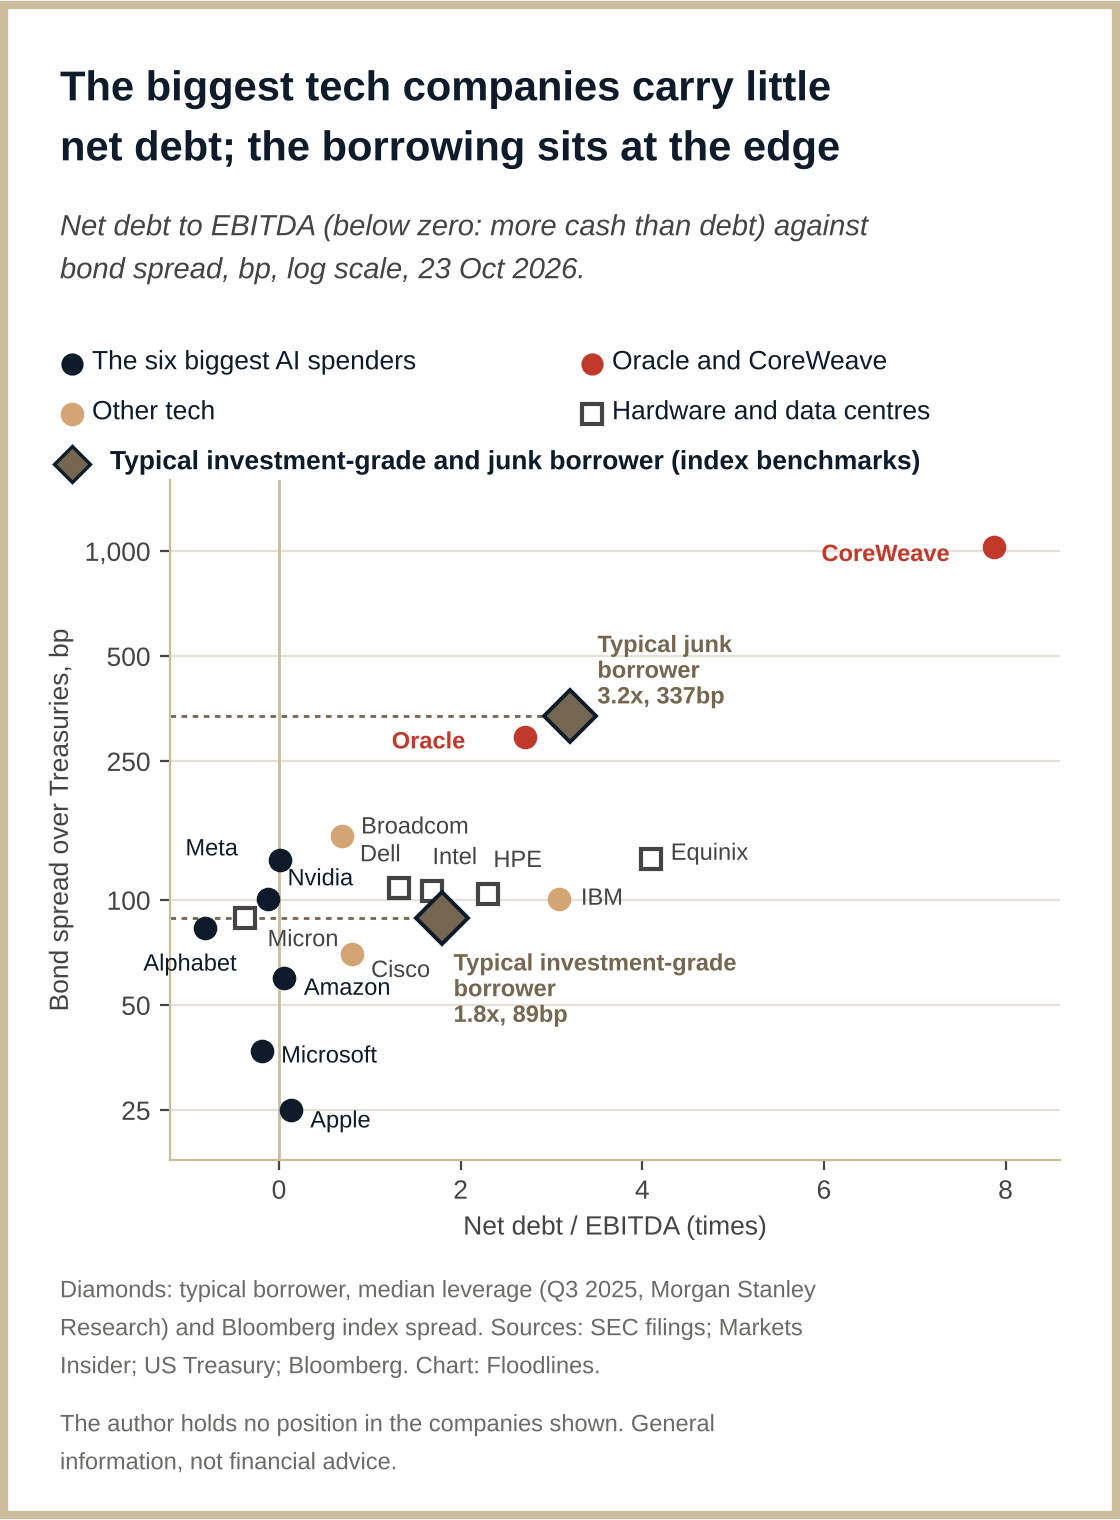
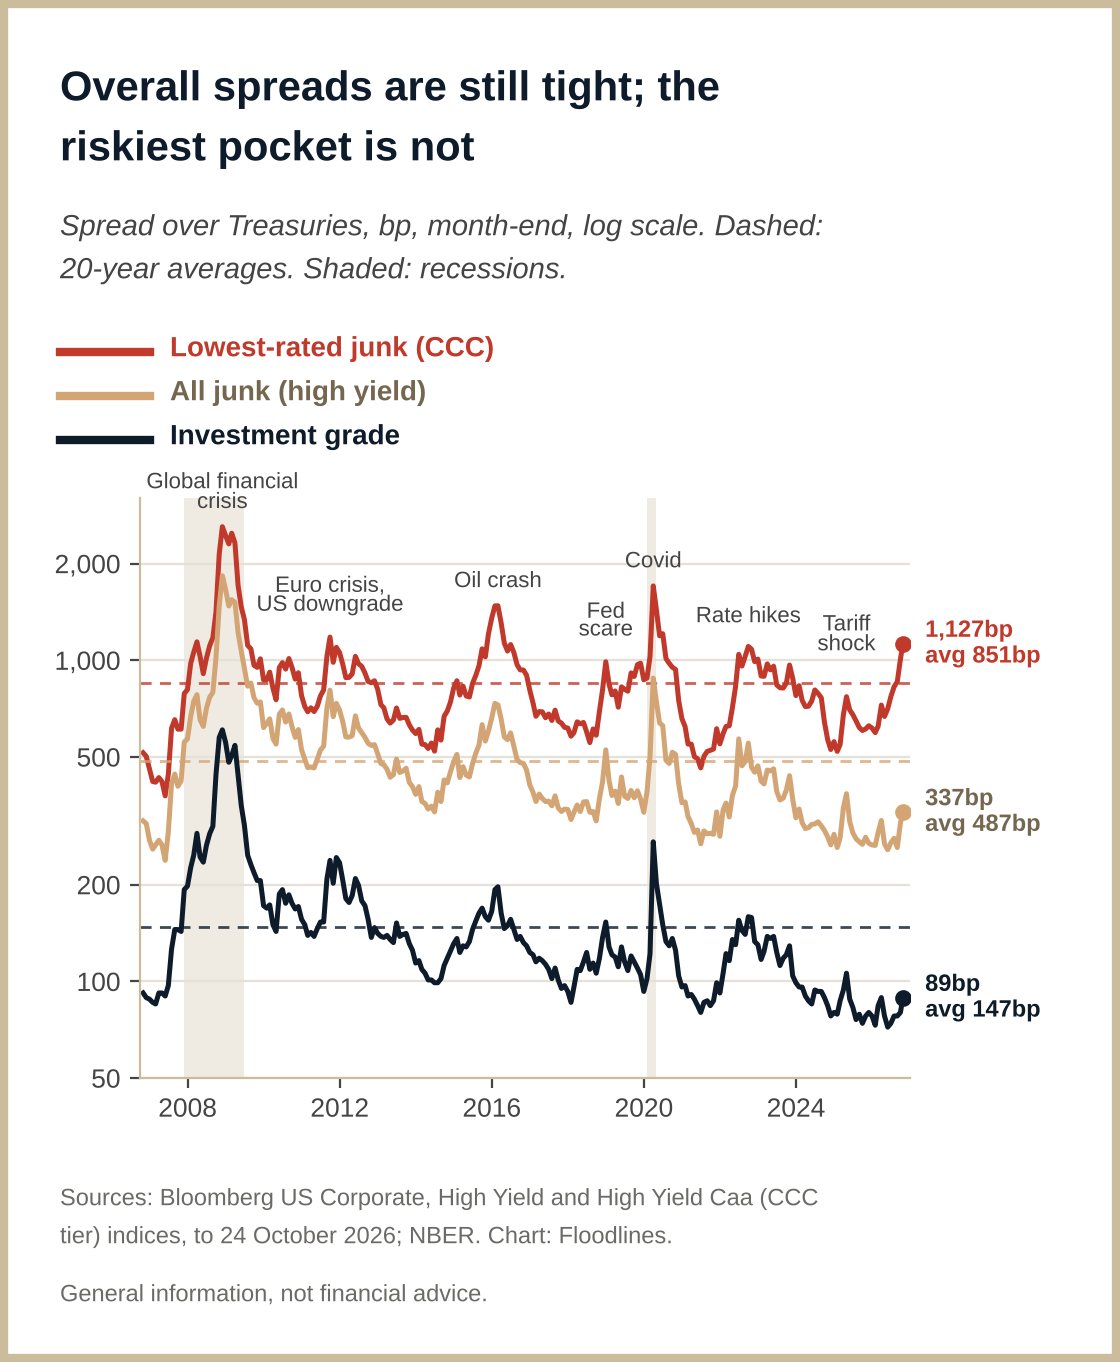
Credit spreads, the extra yield companies pay over US government bonds to borrow, are a classic risk gauge, though rarely an exciting one. The drama typically starts in the riskiest pockets and moves fast: in credit, when it rains, it pours. AI credit fears spooked the market in October: CoreWeave's bonds traded at yields near 15%, a spread close to that of the lowest-rated junk. Yet the broad junk market is still calm, at 337bps, below its 20-year average of 487bps, as corporate profits hold up and most big AI spenders carry surprisingly little debt (Bloomberg).
What needs watching is the riskiest pocket. CCC spreads, on the lowest-rated junk borrowers, have climbed to 1,127bps, their highest since mid-2020 and well above their 20-year average of 851bps (Bloomberg). That matters because CCC blowouts have come with sell-offs in shares: in all eight since 1998, US shares fell 14% to 57% from their peak.
My reading: credit spreads remain tight overall, but the riskiest pocket is flashing amber. I treat CCC widening as an early warning for shares, so I am watching it closely.
The treat: AI-driven growth, in a sentiment costume
The AI build-out has been a meaningful contributor to US growth this year, with sell-side estimates putting it at 0.6 to 1.5 percentage points of GDP growth (Bloomberg). With solid corporate fundamentals, in theory, it should stay a treat for investors. But sentiment soured in October on inflation and AI bubble fears: chips are down about 15% this month, the S&P 500 also trended lower. If the gloom persists, it could spread from chips to the broader market.
Against this gloomy backdrop, strong results from AI reporters this season so far, including record guidance from TSMC and Lam Research and enough operating cash to fund their spending at seven of the eight on the chart, have failed to lift the mood (company releases). In a separate count of seven AI and chip results to 22 October, six fell or went nowhere against their benchmarks.
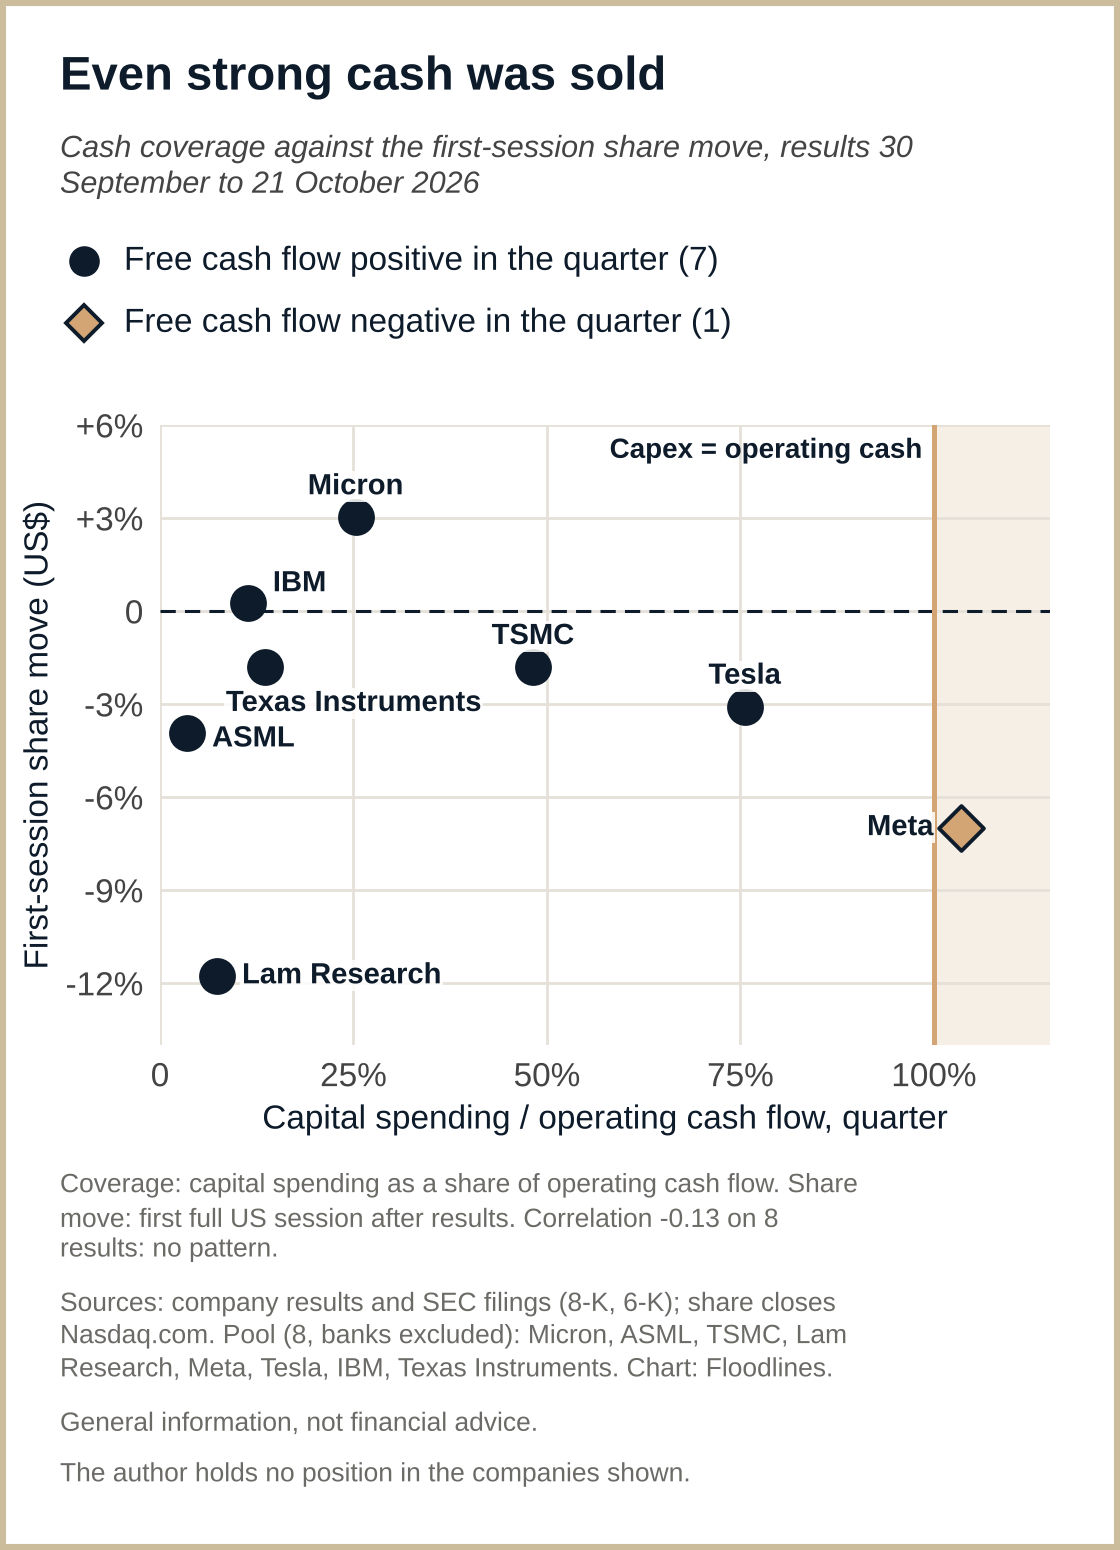
As sentiment departs from reality, investors could face further equity volatility in the coming weeks. And if the gloom lingers while the build-out keeps growth going, it could give the Fed room to hike. The upcoming results from Alphabet, Microsoft and Amazon are an important reality check: does fear lead to more fear, or give way to clarity?
My reading: I respect the power of sentiment. Will fear be met with more fear? AI growth is the one that could be a treat, but it wears sentiment as its costume, and the costume could turn it into a trick. How the market reacts to the coming results could shed more light on whether investors get the treat.
The tide
I respect the power of sentiment when it takes hold. It has turned against investors well beyond chips, leaving few places to hide. US Treasuries have sheltered investors for two weeks, but the conditions for a yield trap are in place. Credit looks calm overall, but CCC is flashing amber, and I am watching it. In equities, only one of seven AI and chip results has beaten its benchmark, a sign of how far sentiment has drifted from fundamentals. A sell-off like this is a warning but can also create opportunities. For my part, I am not ready to act on them, not until this week's Fed message and big earnings show the fear easing.
The week as a test
| When (Sydney) | What | What it decides |
|---|---|---|
| Wed 28 Oct, before 11:00 (call 11:00) | SK hynix third-quarter results | Is the chip sell-off about orders, or about funding? |
| Wed 28 Oct, 11:30 | Australia CPI (September) | Is inflation adding fuel at home? Sets up the RBA on 3 November |
| Thu 29 Oct, 00:45 | Bank of Canada decision | Another energy exporter's read on the oil shock |
| Thu 29 Oct, 05:00 (Wed 28 Oct, 14:00 US Eastern); press conference 05:30 | The Fed's decision and the Chair's press conference (no new projections) | Hold or hike: does the Fed read the yield fall as damage to growth? |
| Thu 29 Oct, about 07:00 | Microsoft and Alphabet results (Wed 28 Oct, US) | Do the big AI buyers pay for their spending from operating cash? |
| Thu 29 Oct, 12:00 (results and call) | Samsung Electronics third-quarter results | The memory leg of the AI build-out |
| Thu 29 Oct, 23:30 | US Q3 GDP and September PCE inflation | Is AI still lifting growth? Inflation in the Fed's own gauge |
| Fri 30 Oct, 00:15 | ECB decision | Are the other havens tightening too? |
| Fri 30 Oct, about 07:00 | Amazon results (Thu 29 Oct, US) | The last of the four big AI buyers |
| Fri 30 Oct, early afternoon (no fixed time) | Bank of Japan decision | Does Japan keep tightening? |
SourcesShow all 19Hide
- AI build-out contribution to US real GDP growth in 2026: about 0.6 to 1.5 percentage points, range of sell-side estimates (Bloomberg, October 2026); official statistics may understate AI's contribution (Bloomberg Brief, 17 July 2026).
- Meta: third-quarter results, 21 October 2026, via SEC EDGAR; capital spending as a share of operating cash (103.5%), Floodlines analysis of Meta's quarterly filing (purchases of property and equipment over operating cash flow, finance leases excluded).
- Ten-year yields: US Treasury, daily par yield curve, 10-year: 5.24% on 9 October, 5.00% on 23 October, 4.01% on 23 October 2025. Twenty-year daily average: 2.89% (Federal Reserve H.15 via FRED (DGS10)); Floodlines calculation.
- Chart 1: daily, from the last close of 2025 to Fri 23 October 2026. US 10-year yield, US Treasury par yield curve; S&P 500 Total Return (dividends reinvested), closes from Yahoo Finance; PHLX Semiconductor Sector Index, price only, closes from Yahoo Finance. Index levels are not reproduced. Floodlines calculation.
- Two-week moves (trick one), Fri 9 to Fri 23 October: US 10-year -24bps, as in the ten-year yields line; PHLX Semiconductor Sector Index 12,572.42 to 10,779.46 (-14.3%), Yahoo Finance; S&P 500 Total Return -2.4%, as in chart 1. Floodlines calculation.
- The Iran war: Congressional Research Service, R48887, "U.S. Conflict with Iran", 26 March 2026; US State Department, Office of the Legal Adviser, 21 April 2026.
- Yield traps in history: US 10-year yield, Federal Reserve H.15 via FRED (DGS10): 5.94% on 4 February 1994 and 8.05% on 7 November 1994; 3.86% on 26 July 2023 and 4.98% on 19 October 2023; 3.63% on 16 September 2024 and 4.79% on 13 January 2025. Fed target rate: FRED (DFEDTAR) for 1994 (3.00% to 6.00% by 1 February 1995); the Federal Reserve's rate table for 2023 to 2025.
- Term premium: Federal Reserve Bank of New York, ACM term premium, daily, read 24 October 2026: +114bps of the 10-year's rise from 26 July to 19 October 2023; 0.98% on 7 October 2026 (the highest since June 2014) and 0.64% on 22 October 2026.
- Real yield: Federal Reserve H.15 via FRED (DFII10), 2.95% on 5 October 2026 (last exceeded in November 2008); US Treasury daily real yield curve, 2.66% on 23 October. AI and the neutral rate: Governor Barr, 17 February 2026, among other Fed officials.
- Oracle and CoreWeave credit: Oracle five-year credit default swap record on 15 October 2026 (S&P Global Market Intelligence), Reuters via BusinessDay, 15 October 2026; Oracle bond and swap stress in 2025, Bloomberg, 24 September 2025; CoreWeave bonds above 15% on 13 and 14 October, SiliconANGLE, 14 October 2026; CoreWeave rating, S&P.
- Big tech debt: Floodlines' calculation from Microsoft, Alphabet, Amazon and Meta latest 10-K and 10-Q filings (SEC EDGAR), debt against cash. Profit margin: FactSet Earnings Insight, 23 October 2026.
- Leverage and bond spreads (chart 2): net debt and EBITDA from each company's latest 10-K or 10-Q (SEC EDGAR), Floodlines' calculation; bond prices from Markets Insider, 23 October 2026, against US Treasury par yields of the same maturity; typical investment-grade and junk borrower: median net debt to EBITDA, third quarter of 2025, Morgan Stanley Research, in Guggenheim Corporate Credit Quarterly, Q1 2026, against Bloomberg US Corporate and US Corporate High Yield index spreads, 24 October 2026.
- Guidance and margins: TSMC third-quarter 2026 results and fourth-quarter guidance, 15 October 2026; Lam Research Form 8-K, Exhibit 99.1, 21 October 2026 (SEC EDGAR).
- CCC scares since 1998: Floodlines' count of eight episodes (1998, 2000-02, 2007-09, 2011, 2015-16, late 2018, 2020, 2022); S&P 500 and the US 10-year Treasury yield from FRED (SP500, DGS10) and Yahoo Finance; recessions per NBER. No index levels reproduced.
- Corporate bond spreads (chart 3): Bloomberg US Corporate Index (LUACOAS), US Corporate High Yield Index (LF98OAS) and US Corporate High Yield Caa Index (BCAUOAS, the CCC tier) option-adjusted spreads, month-end, October 2006 to 24 October 2026, Bloomberg. Recessions: NBER.
- The reward count: seven AI and chip reporters to 22 October (ASML, TSMC, Lam Research, Meta, Tesla, IBM, Texas Instruments), listed only to disclose the method; only Texas Instruments beat its benchmark. First-session close-to-close move in US dollars against the same day's benchmark (the chip index for chips, the Nasdaq-100 for cloud spenders and other tech, the S&P 500 for IBM); "fell or went nowhere" counts results that were sold (at or below minus half the implied move) or ignored (between minus and plus half). Closes from Yahoo Finance and Nasdaq; Floodlines calculation.
- Cash coverage (chart 4): company results and SEC filings (8-K, 6-K), filed 30 September to 21 October 2026; share closes from Nasdaq.com, read 24 October. Pool of eight, banks excluded, listed only to disclose the method: Micron, ASML, TSMC, Lam Research, Meta, Tesla, IBM, Texas Instruments. "Sold" means a first-session fall of more than 3%. Floodlines calculation.
- October share moves: S&P 500 Total Return +12.4% from the end of 2025 to 23 October 2026 and -0.3% in October (30 September to 23 October); PHLX Semiconductor Sector Index -14.6% in October, closes from Yahoo Finance, Floodlines calculation.
- The week as a test: release calendars of the ABS, the Bank of Canada, the Federal Reserve, the BEA, the ECB and the Bank of Japan, read 23 and 24 October 2026; company times from company notices (SK hynix 21 October, Samsung 8 October, Microsoft 7 October, Alphabet 6 October, Amazon 15 October). Times are Sydney (AEDT), with US Eastern beside the US rows.
Currency: index changes are in US dollars. The S&P 500 is shown as total return (dividends reinvested); other index changes in this piece, including the PHLX Semiconductor Sector Index on chart 1, exclude dividends. Yields are in percent; changes are in basis points (bps), with 100bps equal to one percentage point.
Company, index and benchmark names are trade marks of their owners and are used only to identify the companies, indices and benchmarks concerned. That includes the bond indices compiled by Bloomberg Index Services Limited, and the PHLX Semiconductor Sector Index and the Nasdaq-100 Index, owned by Nasdaq, Inc. No company, index owner, benchmark administrator or data publisher named here sponsors or endorses Floodlines.
Important information
General information only. Floodlines is not licensed to provide financial product advice, and nothing here is a recommendation to buy, hold or sell. The author holds no position in any company named. Floodlines is not a registered investment adviser.
Show full termsHide full terms
Important. Floodlines publishes independent research and commentary on the economy, markets, industries and supply chains. It is general information only. Floodlines is not licensed to provide financial product advice and does not provide it. Nothing here is a recommendation to buy, hold or sell any financial product. Nothing here has been prepared by reference to any reader’s objectives, financial situation or needs, and Floodlines does not respond to individual questions about personal circumstances, holdings or portfolios. Views are the author’s own as at the date of publication, may change without notice, and may be wrong. Where a piece says how sure the author is of a view, or what would change her mind, that describes her confidence in her own reading of events. It is not an instruction to any reader. Before making any financial decision, obtain advice from a licensed financial adviser and consider the relevant product disclosure statement or offer document. Where a piece reports the author’s past calls, it is a record of her own process, wrong calls included. Past calls are not an indicator of future performance.
Interests. No company in this piece is discussed as an investment. Meta is named for its results, its debt and the market's reaction to them. Microsoft, Alphabet and Amazon are named for the dates of their results and for the cash test they decide and for their debt; Oracle and CoreWeave only for their credit and the market's reaction to it; SK hynix and Samsung Electronics only for the dates of their results; TSMC and Lam Research only for their record guidance. The other companies on charts 2 and 4, and the other AI and chip reporters behind the reward count, appear only in the charts and the Sources, to disclose the method. The author holds no position in any of these companies (shares, bonds, loans, options or other securities), in any technology, semiconductor, AI or Nasdaq-100 fund, in options or futures on the PHLX Semiconductor Sector Index, in US Treasuries or US government bond funds (long or short), or in US interest-rate futures or options. Other companies appear only as sources of news and data. US government bonds are discussed as an asset class, not as particular products. The indices, other government bond yields and corporate bond spreads are used only as measures of markets. Floodlines receives no payment from any issuer, index owner, underwriter or dealer in connection with anything discussed.
United States readers. Floodlines is a publication of general and regular circulation. It provides impersonal commentary only, does not provide personalised investment advice, does not hold itself out as an investment adviser, and is not registered as an investment adviser with the SEC or any state. Floodlines will not answer questions about your portfolio or circumstances. Floodlines receives no compensation from any issuer, underwriter or dealer in respect of any security discussed.