
The fear around AI did not fade last week. It grew. Alphabet fell 12.6% on its results, Intel 28.6%, and the chip index lost 7.2% on Friday alone. The rest of the US market fared better. Meanwhile, old-economy sectors, including resources, utilities and energy, rose. Congratulations, Sydney and London: the ASX 200 and the FTSE 100 topped the major markets in October, in US dollars. Still, I think we can time-travel back to the steam age now and then. We just can't stay.
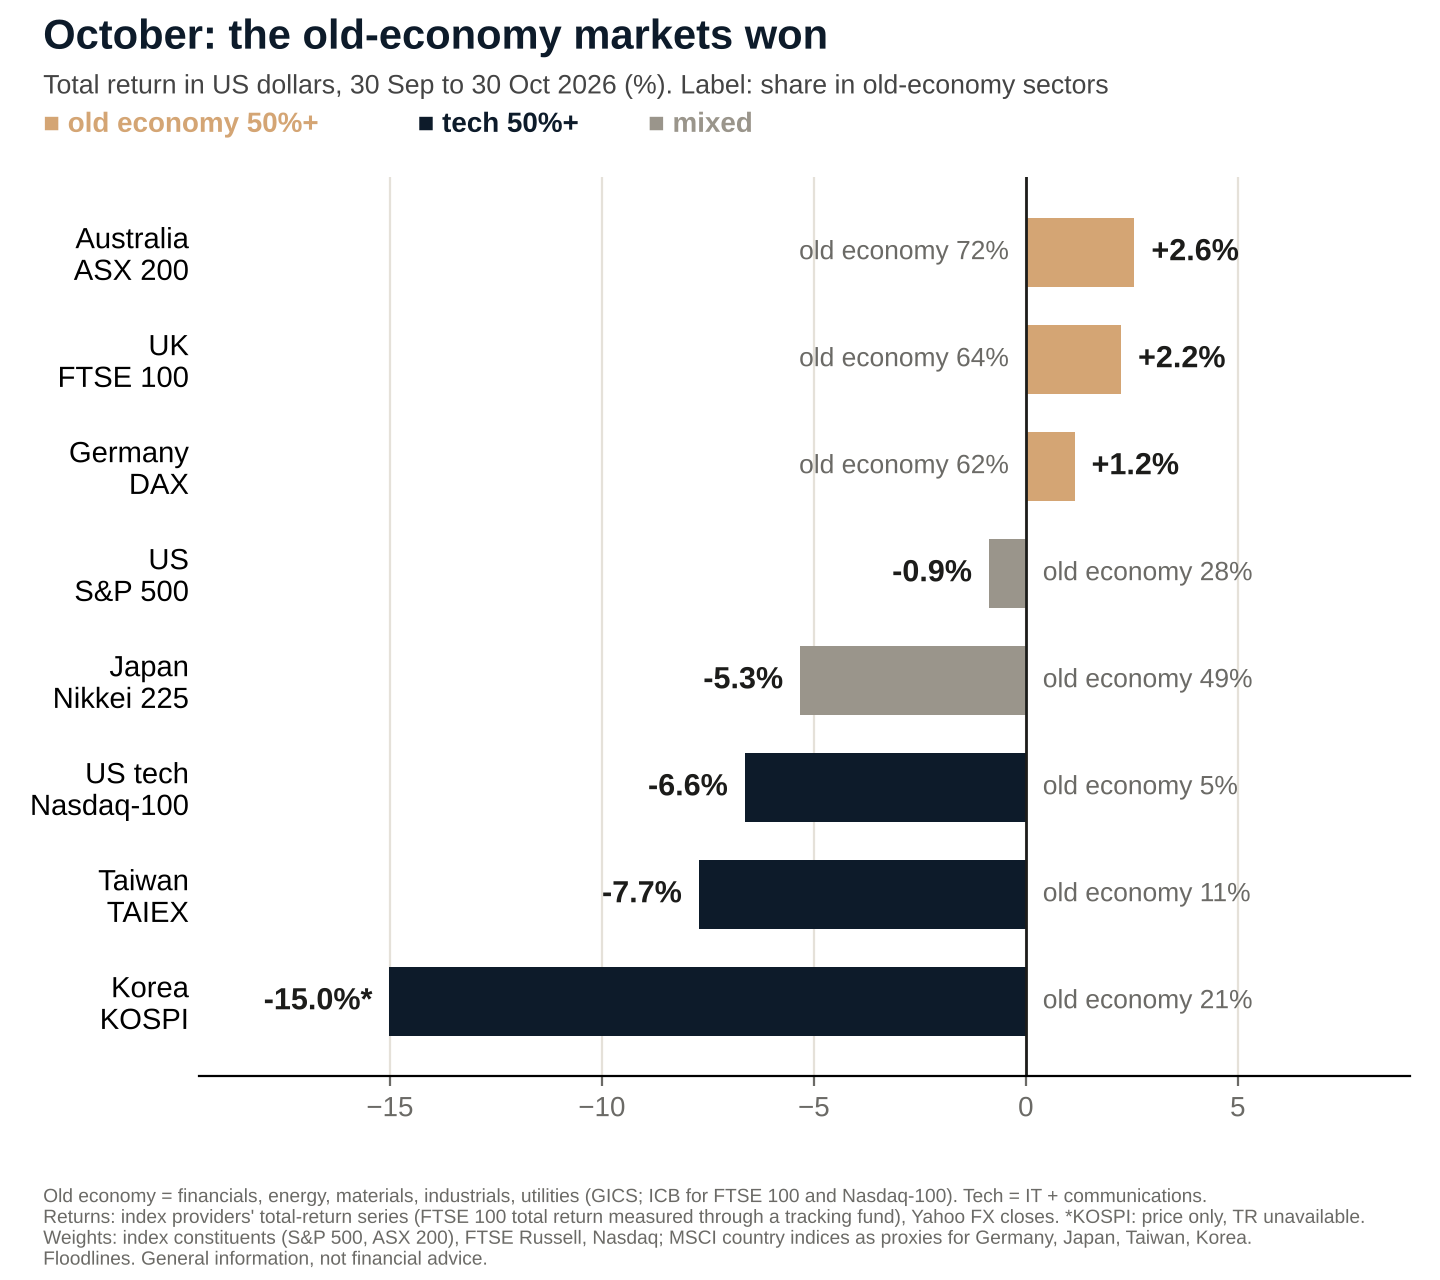
- Capital went back to the steam age: this earnings season, bubble fear chilled the AI craze and the old economy (banks, energy, mining) got the attention again. In October, the ASX 200 rose 2.6% and the FTSE 100 2.2%; the S&P 500 slipped 0.9% and the Nasdaq-100 fell 6.6% (in US dollars).
- The time machine cannot stay for long: falling short-term yields could signal growth worries, and if growth gives way, no corner is spared.
- What could bring capital back to AI? The AI gloom may take time to fade, but strong earnings don't go unnoticed for long. Three things could bring AI back to centre stage: better cash coverage, a cheaper way to compute, or the Fed blinking.
Capital went back to the steam age
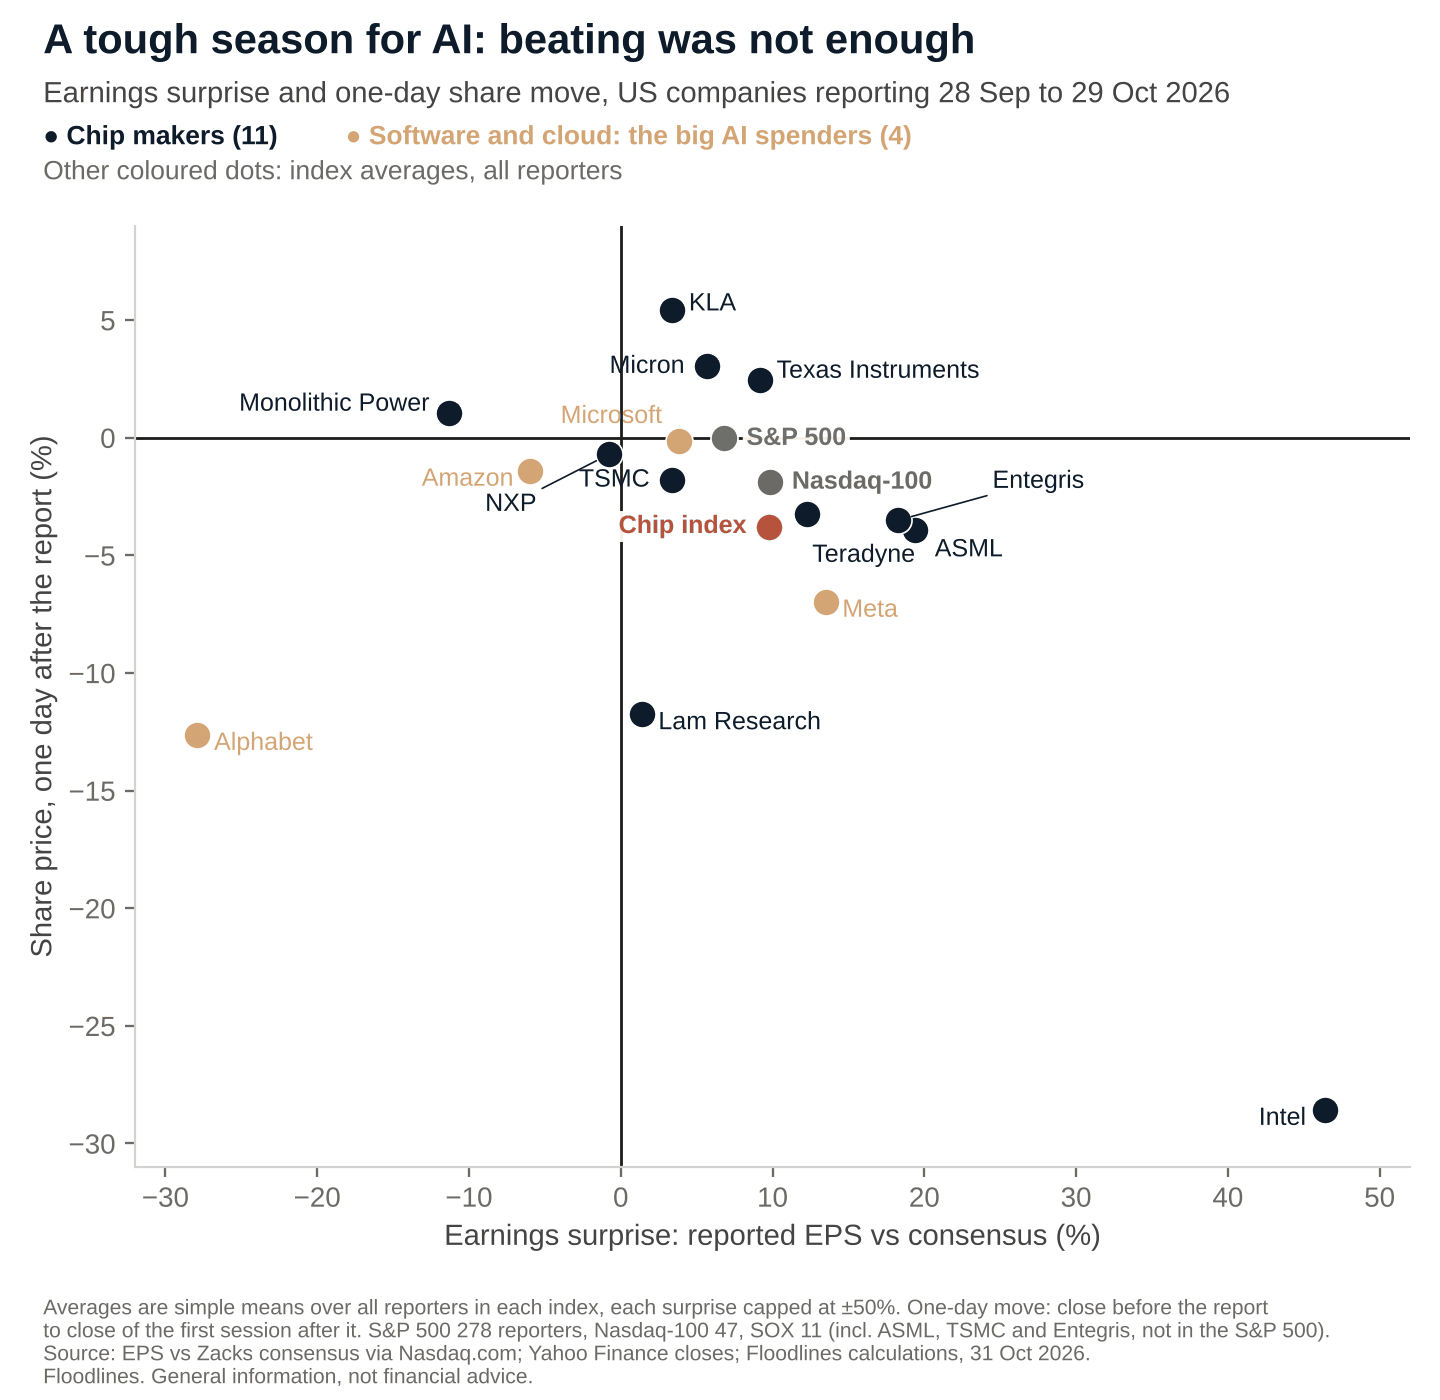
This results season has been tough on AI players. Of the 15 that reported, 11 beat forecasts, and only Micron, Texas Instruments and KLA rose the next day; Intel, Lam Research and Meta beat and still fell (28.6%, 11.8% and 7.0%). On average, chipmakers beat by 9.8% and fell 3.8% the next day, the average Nasdaq-100 company that reported fell 1.9%, and the average S&P 500 company was flat.
Earnings surprise and one-day share move, US companies reporting 28 September to 29 October 2026.
Meanwhile, investors boarded a time machine back to the steam age, when coal, rail and banks ran the world. Old-economy shares are back in fashion, top hat and all.
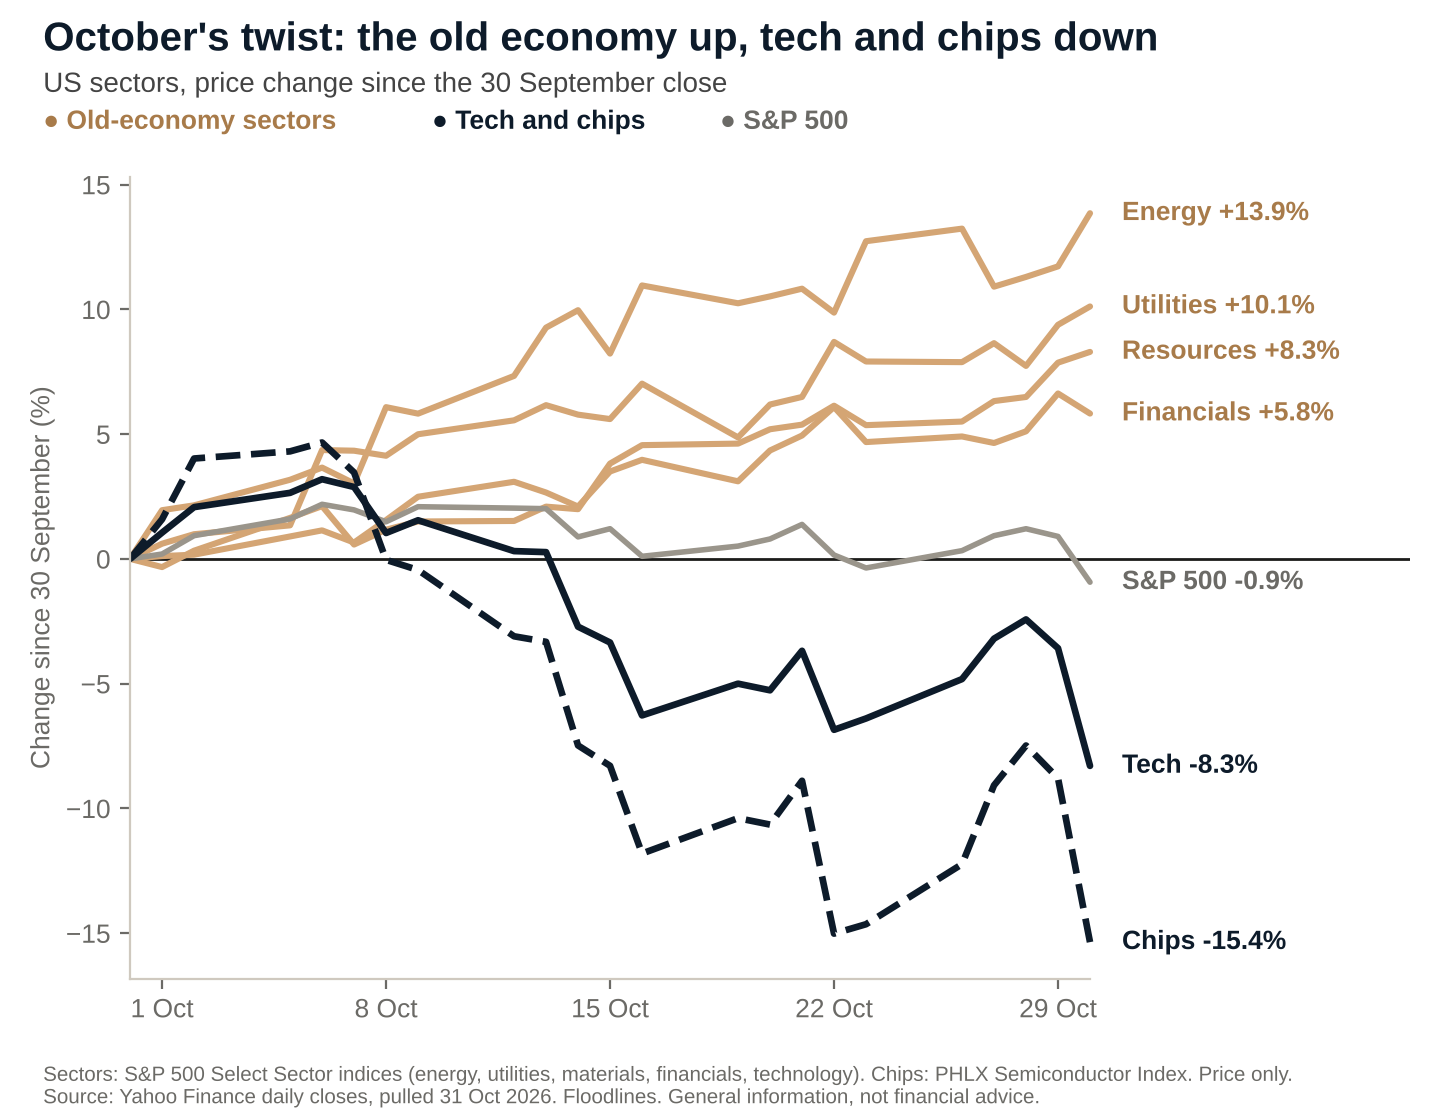
In October, the US old-economy sectors* rose: energy 13.9%, utilities 10.1%, resources 8.3% and financials 5.8%, while tech fell 8.3% and chips 15.4%. Even industrials split along the same line: the data-centre fifth fell about 10%, the rest rose.
US sectors, price change since the 30 September 2026 close, daily to 30 October.
Zoom out to the world, and it confirms the move: the only three major markets that rose, Australia, the UK and Germany, are each more than 60% old economy; the tech-heavy markets fell hardest.
Total return in US dollars, 30 September to 30 October 2026, dividends reinvested. Label: share of the index in old-economy sectors.
My reading: in tech, sentiment has parted ways with earnings, and so far nothing has shifted the mood. Not surprisingly, the old economy became the shelter. Nvidia's results on 17 November (US) may be the season's last shot. If they fail to lift the mood, the shelter could hold for a while.
The time machine cannot stay for long
As chips slid in October, the classic haven trade into long-dated US Treasuries revived, pulling the 10-year yield down. The 2-year, which tracks rate expectations, lagged until last week. Then it fell 13bps to 4.56%, twice as far as the 10-year, as the odds of a December Fed hike slipped to 74% from 88% on fed funds futures. Still high, but easing.
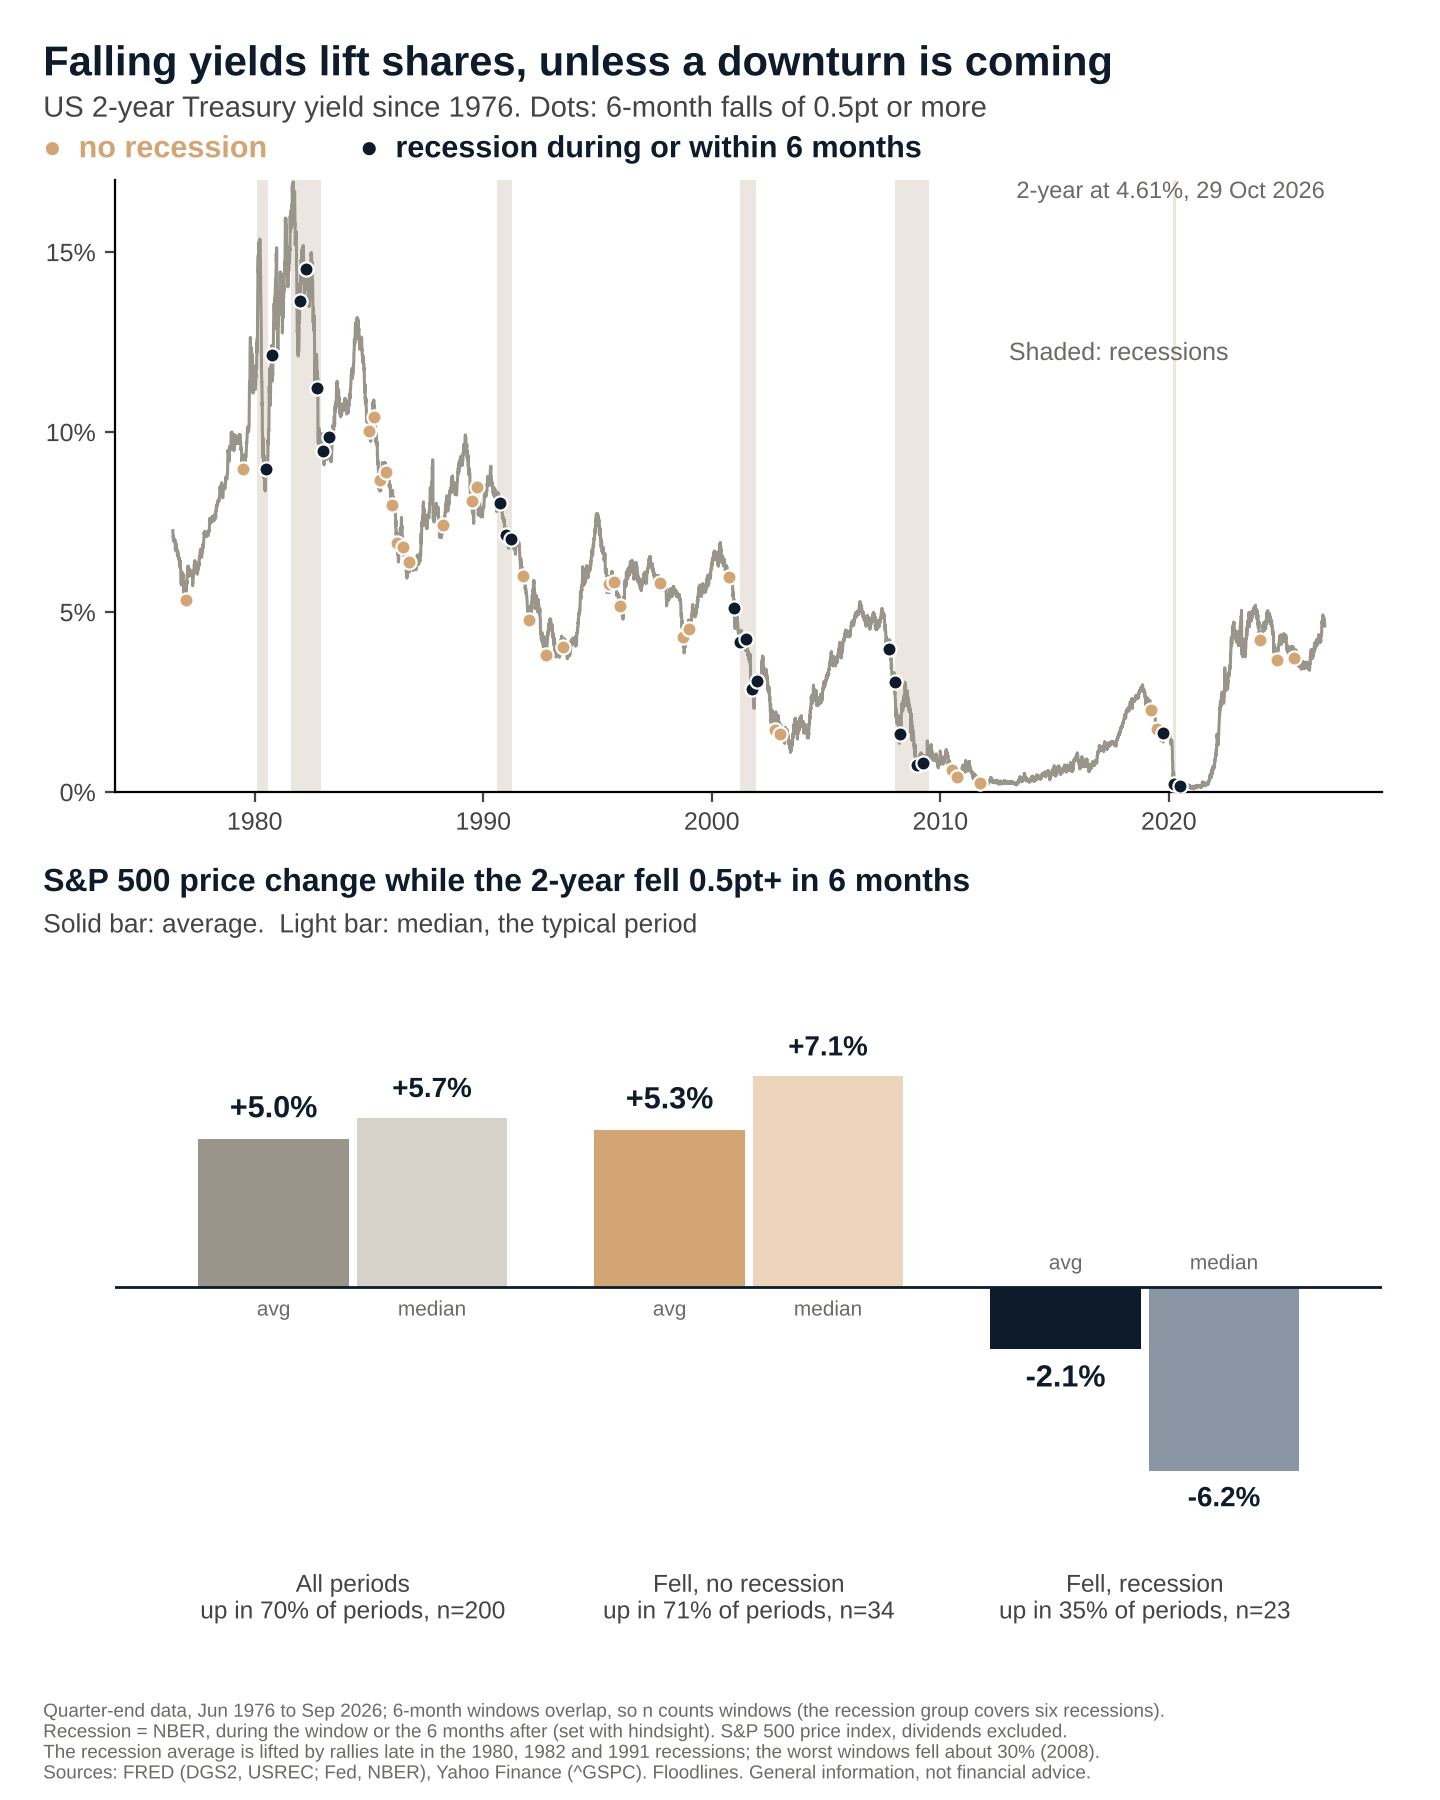
Good news for shares? Not really, as we saw last week. Historically, sharp falls in short-term yields have usually lifted shares, unless an economic downturn followed, when shares tended to slip instead. This is not yet one of those sharp falls: the 2-year is still 68bps higher than six months ago. But the record shows what is at stake if growth cracks.
S&P 500 price change when the 2-year Treasury yield fell half a point or more in six months, June 1976 to September 2026, split by whether a recession was under way or began within six months. Average (median in brackets): all periods +5.0% (+5.7%); no recession +5.3% (+7.1%); recession near -2.1% (-6.2%). The average for the recession cases is lifted by rallies late in the 1980, 1982 and 1991 recessions; the worst periods fell about 30% (2008).
Growth is resilient, for now: US GDP grew 3.4% annualised in the third quarter. What worries investors is that the threats to growth have built up in recent weeks: the cost of capital has stayed high this year, and credit risk is rising at the weaker end of AI financing. If those slow the AI build-out, they could stall the flywheel that has carried US growth, and quickly. If growth wavers, no risk asset is immune, the old economy included.
My reading: the old economy shelters investors from an AI problem, not from a growth problem. The more crowded the carriage, the harder the fall if the AI build-out is forced to slow and growth weakens, and there will be few places left to hide.
What could bring capital back to AI?
It is difficult to argue against AI's earnings: chipmakers beat forecasts by 9.8% on average this season. But beating forecasts is not the same as paying for the spending.
Three overhangs keep investors away from the AI trade: an elevated cost of capital, rising credit risk and dearer compute. There are three ways to drive the time machine back to the present.
- Better cash coverage. Whether AI revenue can cover the spending has been investors' chief concern for quarters, and the cover is getting thinner: the four biggest US spenders put about 115% of their operating cash into capex in the third quarter, up from about 96% in the second. Reversing that would cure the root of the AI trade's problem and ease the credit worry. Wider business adoption could speed up revenue, and there is plenty of room: as of May, still only one in five US firms used AI.
- A cheaper way to compute. The cost of compute sets the pace and price of AI, and it is hard to bring down while memory chip prices surge and the energy bill grows: power is a data centre's biggest running cost once the chips are paid for, though memory is the sharper squeeze. A DeepSeek-style efficiency breakthrough, in models, chips or power, could change that, but it cannot be timed. It would split the trade: software would win again, while chipmakers could suffer at first.
- The Fed blinks. The AI build-out increasingly runs on borrowed money and long paybacks, so higher rates shrink what future AI profits are worth today. With rates this high, a Fed that stops hiking and starts easing would lower that cost at once. But I suspect something will snap first and set off a sharp market episode, so AI stocks could fall further before any recovery takes hold.
My reading: in the near term, better cash coverage is what could win investors back to the AI trade. A breakthrough or a Fed blink can't be timed with much confidence.
The tide
The AI scare sent investors back to the steam age, and it could yet become a growth scare. The time machine can't stay long: if growth cracks, no corner of the market is spared, the old economy included. In the end, it comes down to cash. With sentiment no longer on their side, the big AI spenders must prove their revenue can cover their spending before investors come back.
The week as a test
Tuesday 3 November is the week's key day: the factories, the memory bill, the RBA and the midterms, in one Sydney day.
| When (Sydney) | What | What it decides |
|---|---|---|
| Sun 1 Nov | Korea October exports (out) | Yes, AI chip demand is still running: chip exports rose about 259% on a year earlier to US$56.4bn, a record, though last year's holiday-shortened October flatters the rise |
| Tue 3 Nov, 02:00 (Mon 2 Nov, 10:00 US Eastern) | US ISM manufacturing (October) | Is the old economy growing, or is the shelter cracking? |
| Tue 3 Nov, about 08:30 | Apple results | Is the memory bill squeezing the buyers of chips? |
| Tue 3 Nov, 14:30 | RBA decision | A demand tool against a supply shock: a fifth hike this year? |
| Tue 3 Nov (US polling day) | US midterms | Who holds Congress; what it means, in Thursday's Floodlines |
| Thu 5 Nov, 23:00 | Bank of England decision | The steam-age market's home central bank, with inflation at 3.5% |
| Sat 7 Nov, 00:30 (Fri 6 Nov, 08:30 US Eastern) | US payrolls (October) | Is bad news bad news again? |
| Wed 11 Nov, 00:30 (Tue 10 Nov, 08:30 US Eastern) | US CPI (October) | Does inflation give the Fed room to blink? |
SourcesShow all 13Hide
- Results moves: first-session close-to-close changes, Alphabet and Microsoft on Thu 29 October (results 28 October, US), Intel and Amazon on Fri 30 October (results 29 October, US); PHLX Semiconductor Sector Index 11,518.20 to 10,688.80 on 30 October (-7.2%). Closes from Yahoo Finance, read 31 October 2026; Floodlines calculation.
- Chart 1: total returns, 30 September to 30 October 2026, converted to US dollars at Yahoo Finance FX closes. Total-return series: S&P 500 Total Return and S&P/ASX 200 Accumulation (Yahoo Finance); Nasdaq-100 Total Return, XNDX (Nasdaq Global Indexes); DAX (STOXX/Qontigo); Nikkei 225 Total Return (Nikkei Inc.); TAIEX Total Return (TWSE); FTSE 100 Total Return (measured through a fund that tracks it); KOSPI price only (total return unavailable). Old economy = GICS financials, energy, materials, industrials and utilities (ICB equivalents for the FTSE 100 and Nasdaq-100). Sector weights: FTSE Russell FTSE 100 and Nasdaq NDX factsheets (30 September 2026); index constituent weights for the S&P 500 (29 October) and S&P/ASX 200 (30 October); MSCI Germany, Japan, Taiwan and Korea factsheets (30 September 2026) as stand-ins for the DAX, Nikkei 225, TAIEX and KOSPI. Floodlines calculation.
- US sectors: S&P 500 Select Sector indices (energy, utilities, materials, financials, industrials, technology), measured through funds that track them, and the PHLX Semiconductor Sector Index, closes 30 September to 30 October 2026, Yahoo Finance. Industrials split: constituents and weights of the Industrials Select Sector Index, 29 October 2026; AI-linked = data-centre power generation, grid and electrical equipment, cooling, and electrical and mechanical contracting (11 names: GE Vernova, Eaton, Vertiv, Quanta Services, Bloom Energy, Comfort Systems, EMCOR, Hubbell, Generac, Johnson Controls, Trane); Floodlines calculation.
- Earnings surprise chart and AI-player averages: earnings per share against Zacks consensus via the Nasdaq.com earnings calendar API; daily closes from Yahoo Finance; members of the S&P 500 (Wikipedia list), Nasdaq-100 (Nasdaq.com) and PHLX Semiconductor index (Nasdaq Global Indexes, 30 October 2026); all pulled 31 October 2026. 284 companies reporting 28 September to 29 October (30 October results left out: the feed's figures were not like-for-like); AI players are the 11 SOX members that reported, including Micron (30 September), plus Microsoft, Alphabet, Amazon and Meta. Surprises capped at plus or minus 50% for averages; one-day move is the close before the report to the close of the first session after it. Floodlines calculation.
- UK inflation: Office for National Statistics, Consumer price inflation, CPI 12-month rate 3.5%.
- US yields and breakeven: US Treasury, daily par and real yield curves, read 31 October 2026: 2-year 4.69% (23 October) to 4.56% (30 October); 10-year 5.00% to 4.94%; 10-year breakeven (nominal less real) 2.34% on both dates. Floodlines calculation.
- Fed hike odds for 9 December: CBOT 30-day fed funds futures, January 2027 contract against the effective fed funds rate of 3.88% (FRED (EFFR)), closes via Yahoo Finance, 23 October (4.10%, 88%) and 30 October 2026 (4.065%, 74%); not CME settlements; Floodlines calculation. US yields for October: 10-year 5.29% to 4.94%, 2-year 4.88% to 4.56%, 30 September to 30 October.
- Australia: household debt to income, RBA table E2 (178.4%, June quarter 2026; 67.9%, March quarter 1990); cash rate, RBA table A2; hike odds, CBA, 28 October 2026 (about 90%) and BBH via FXStreet, 28 October 2026 (85%); cost of a 25bps rise on a A$600,000, 30-year loan at 6.20%, Floodlines calculation; ASX 200 financials, October 2026. Chart 4: RBA tables A2, H5 (ABS Labour Force) and G1 (ABS CPI); 1990 target ranges at the midpoint.
- Growth and inflation: US Bureau of Economic Analysis, GDP third quarter 2026 advance estimate (+3.4% annualised) and personal income and outlays, September 2026 (core PCE 3.1% on a year earlier), both released 29 October 2026; initial jobless claims 194,000 in the week to 24 October, US Department of Labor via FRED (ICSA); 10-year real yield 2.60% on 30 October, US Treasury real yield curve. AI financing: hyperscaler bond spreads and secondary trading, MLQ citing Reuters and BNP Paribas, 22 August 2026; CCC spread as below.
- Nvidia results date: Tuesday 17 November 2026 (US), NVIDIA, "NVIDIA Sets Conference Call for Third-Quarter Financial Results".
- 2-year Treasury yield, six-month change: 3.88% on 30 April to 4.56% on 30 October 2026, US Treasury daily par yield curve. Yields, recessions and shares since 1976: 2-year Treasury yield, FRED (DGS2); recessions, FRED (USREC, NBER); real GDP, FRED (GDPC1); S&P 500 price index, Yahoo Finance (^GSPC), checked against FRED (SP500). Quarter-end data, overlapping six-month windows, recession set with hindsight; pulled 31 October 2026. Floodlines calculation.
- Korea October exports: chip exports US$56.4bn (+259%), total US$115.3bn (+93.7%), preliminary, Ministry of Trade, Industry and Energy, 1 November 2026, via Korea Times and Seoul Economic Daily, 1 November 2026. AI demand: third-quarter capex from the results releases of Amazon (US$77.3bn, 29 October), Alphabet (US$51.4bn, 28 October), Microsoft (US$39.4bn, 28 October) and Meta (US$34.9bn, 21 October), SEC filings and company investor sites; 2026 plans from company guidance. Capex as a share of operating cash flow, the four combined: about 115% in the third quarter of 2026 (Amazon provisional) and about 96% in the second, Floodlines calculation from the same releases and second-quarter filings. Capex growth: the four's combined third-quarter capex about US$202bn in 2026 against about US$114bn in the third quarter of 2025, including finance leases (company results releases; 2025 total via Platformonomics, October 2025); bases differ slightly by company; Floodlines calculation. Cloud revenue, third quarter 2026, year on year: Google Cloud +103% (Alphabet release, 28 October), Amazon Web Services +39% to US$46.0bn (Amazon release, 29 October). Business AI use: 19.5% of US businesses in May 2026, rising at firms with 20 or more employees, US Census Bureau, Business Trends and Outlook Survey. Energy: Epoch AI, AI data-centre cost breakdown, 14 May 2026 (electricity about 65% of cash operating costs, about 7% of the all-in annual cost of a 1 GW site).
- The week as a test: release calendars of the ISM, the RBA, the Bank of England, the BLS and Korea's trade ministry; times are Sydney (AEDT), with US Eastern beside the US rows.
* Old economy, in this piece: energy, utilities, materials (resources), financials and industrials (GICS sectors).
Currency: index changes are in US dollars, converted at market exchange rates. Chart 1 and the October figures in the opening points are total returns (dividends reinvested; KOSPI price only); other index changes exclude dividends. Oil and iron ore are in US dollars; Australian loan costs are in Australian dollars. Yields are in percent; changes are in basis points (bps), with 100bps equal to one percentage point.
Company, index and benchmark names are trade marks of their owners and are used only to identify the companies, indices and benchmarks concerned. That includes the S&P 500 index (S&P Dow Jones Indices), the FTSE 100 index (FTSE Russell), the PHLX Semiconductor Sector Index and the Nasdaq-100 Index (Nasdaq, Inc.), the MSCI indices (MSCI Inc.), the KOSPI (Korea Exchange), the TAIEX (Taiwan Stock Exchange) and the ICE BofA indices (ICE Data Indices). No company, index owner, benchmark administrator or data publisher named here sponsors or endorses Floodlines.
Important information
General information only. Floodlines is not licensed to provide financial product advice, and nothing here is a recommendation to buy, hold or sell. The author holds no position in any company named. Floodlines is not a registered investment adviser.
Show full termsHide full terms
Important. Floodlines publishes independent research and commentary on the economy, markets, industries and supply chains. It is general information only. Floodlines is not licensed to provide financial product advice and does not provide it. Nothing here is a recommendation to buy, hold or sell any financial product. Nothing here has been prepared by reference to any reader’s objectives, financial situation or needs, and Floodlines does not respond to individual questions about personal circumstances, holdings or portfolios. Views are the author’s own as at the date of publication, may change without notice, and may be wrong. Where a piece says how sure the author is of a view, or what would change her mind, that describes her confidence in her own reading of events. It is not an instruction to any reader. Before making any financial decision, obtain advice from a licensed financial adviser and consider the relevant product disclosure statement or offer document. Where a piece reports the author’s past calls, it is a record of her own process, wrong calls included. Past calls are not an indicator of future performance.
Interests. No company in this piece is discussed as an investment. Alphabet, Intel, Amazon, Meta, Microsoft, Micron, Texas Instruments, KLA, ASML and Lam Research are named only for the market's reaction to their results; Apple and Nvidia only for the dates of their results; DeepSeek only for its January 2025 model; the industrial companies listed in the sources only to define a split of an index. The author holds no position in any of these companies (shares, bonds, loans, options or other securities), in any technology, semiconductor, AI or Nasdaq-100 fund, in options or futures on the PHLX Semiconductor Sector Index, in US Treasuries or US government bond funds (long or short), or in US interest-rate futures or options. Other companies appear only as sources of news and data. The indices, government bond yields, oil and iron ore prices are used only as measures of markets. Floodlines receives no payment from any issuer, index owner, underwriter or dealer in connection with anything discussed.
United States readers. Floodlines is a publication of general and regular circulation. It provides impersonal commentary only, does not provide personalised investment advice, does not hold itself out as an investment adviser, and is not registered as an investment adviser with the SEC or any state. Floodlines will not answer questions about your portfolio or circumstances. Floodlines receives no compensation from any issuer, underwriter or dealer in respect of any security discussed.