Last week's headlines were dominated by Nvidia and its CEO, well, correction: ex-CEO. As the extramarital scandal grew, the stock was not spared, losing almost 10% in two days, and the "rockstar" of AI walked out of the door after 33 years; Nvidia has not said why. Ok, that's my spicy story to keep you reading. The real story I want to cover is about 'traps' in the market today - maybe duller but could cost more. Some of them look sweet and some look safe. Eventually, though, they might just be traps. Don't get comfortable.
- The growth hollow: US growth data knitted a comfortable "cushion" for the Fed to hike interest rates more aggressively. Look closer, and you will find that growth is hollowing. Hiking into a cooling growth outlook could lead to another policy mistake. It is a trap for the Fed, and for someone betting the economy is as strong as it looks.
- The yield trap: investors turn to US Treasuries when equities fall, but end up with losses as bond yields keep rising. A yield trap is difficult to spot. Treasuries offered protection from the chip scare at first, but they have stopped working and are unlikely to cushion bad news on interest rates.
- The anything-but-AI shelter: capital switched to find shelter in anything but US AI. This AI sell-off has been driven by sentiment, not earnings. If the market comes back to earnings, AI could snap back, though the timing could be longer. Sometimes, a comfort zone does not mean security.
The growth hollow
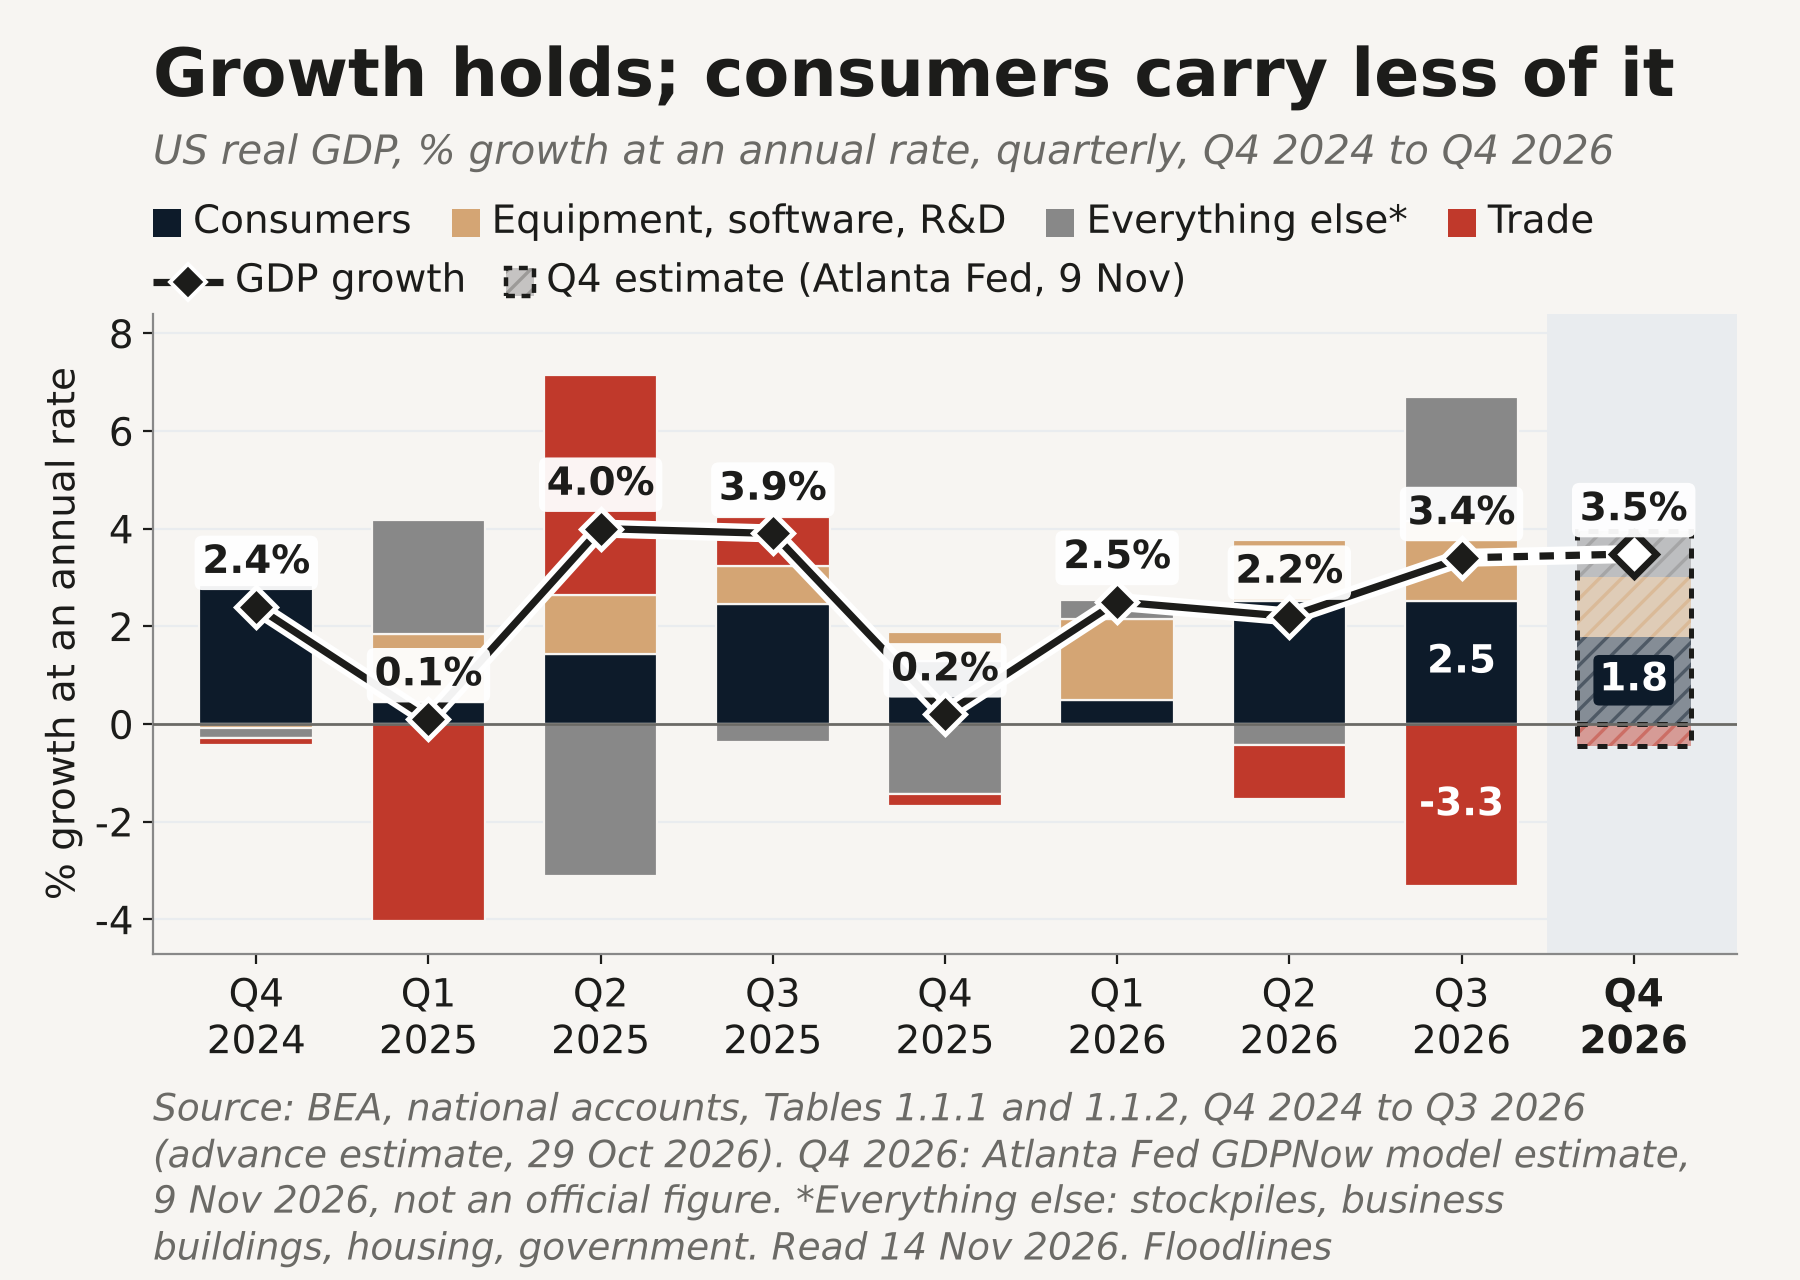
Over the recent quarters, US growth data knitted a comfortable "cushion" for the Fed to hike interest rates more aggressively, with the GDP growing at an annual rate of 3.4% and ISM manufacturing index staying in expansionary territory. I can almost hear the bond market whisper: "don't be like 2021, hike more, hike faster".
Look closer, and you will find that growth is hollowing. Consumption and AI build-out have been main drivers of GDP growth this year, but both could be slowing down over the coming quarters. Results from the midterm elections have unveiled the reality that 40 out of 41 local votes on the ballot have turned against data centre build-out (Ballotpedia). At least 14 states have considered 1 to 3 year moratoriums on new data centres (National Conference of State Legislatures).
Additionally, consumption is already expected to be slowing down from 3.8% in the third quarter to 2.6% in the fourth, on the Atlanta Fed's estimate, as real pay turned negative for American households.
US real GDP, % growth at an annual rate, quarterly, Q4 2024 to Q4 2026. Source: US Bureau of Economic Analysis; Q4 2026 is the Atlanta Fed's GDPNow model estimate of 9 November, not an official figure.
From a labour market perspective, households put a 45% chance on unemployment being higher in a year, the highest since April 2020 (New York Fed). This paints a picture of unsustainability, consumption running on savings, not pay. Watch this week's retail sales for an update.
Looking ahead, high-stakes moving pieces, including the Anthropic IPO, the US-Iran push-and-pull and the US-China trade renegotiation, could easily choke the market with fear. Fed hiking is unlikely to fix the oil problem. Hiking into a cooling growth outlook with all that in play could lead to another policy mistake. Or, as I call it, a 'trap'. It is a trap for the Fed, and for someone betting the economy is as strong as it looks.
My question: What is holding this growth up, and do you still believe in it?
The yield trap
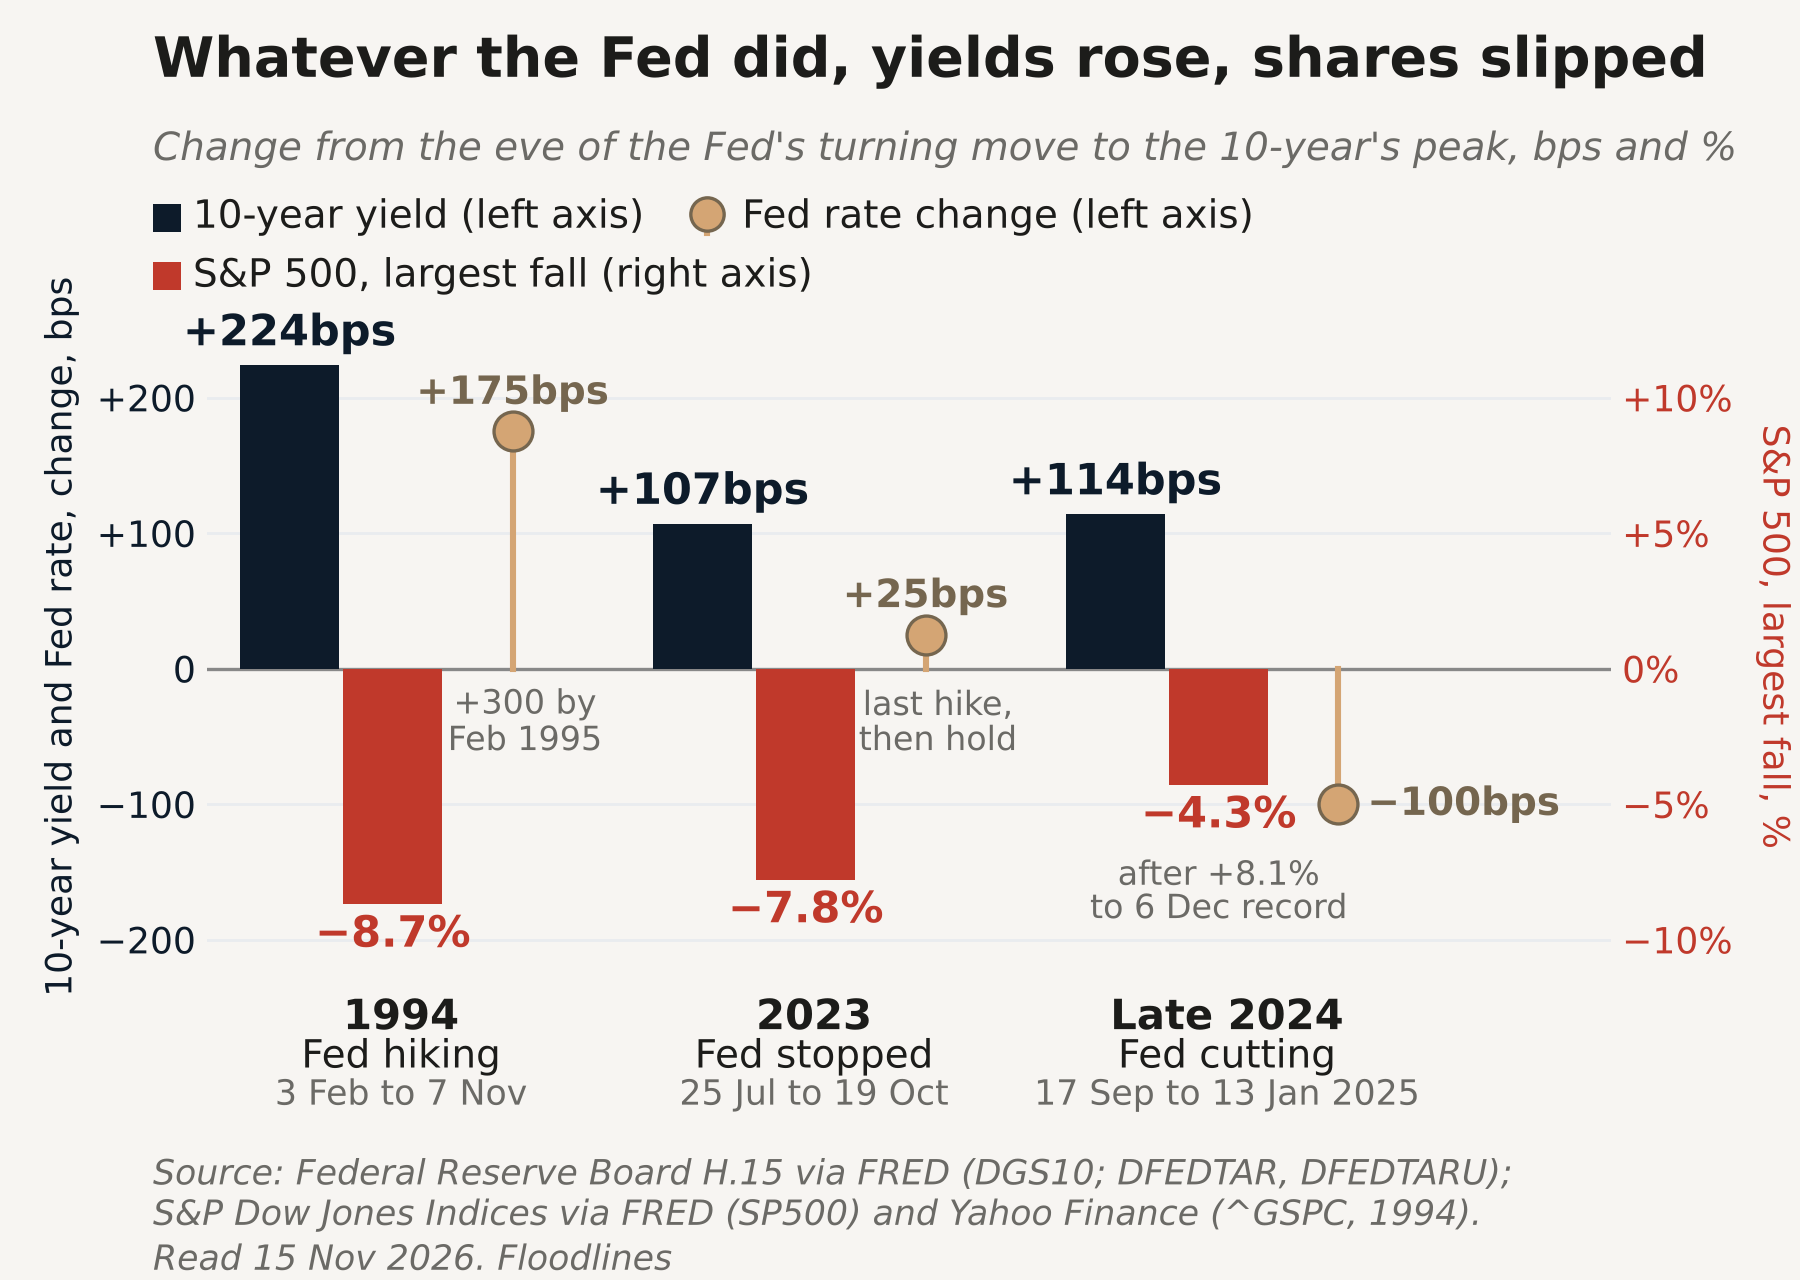
Three weeks ago, I warned of yield traps, where investors turn to US Treasuries when equities fall, but end up with losses as bond yields keep rising. Historically, yield traps could happen regardless of what the Fed is doing.
Think 1994, when the Fed doubled its policy rate in 12 months, and the 10-year jumped 224 basis points (bps) while equities fell about 9%. Mid 2023, when the Fed had stopped hiking, but yields kept climbing from July to mid October while equities fell about 8%. Then late 2024 to early 2025, when the Fed cut rates by 100bps but yields rose about 114bps, and equities fell 4.3% from their December record by January 2025. See, a yield trap is difficult to spot.
Change from the eve of the Fed's turning move to the 10-year's peak, bps and %. Source: Federal Reserve Board H.15 via FRED; S&P Dow Jones Indices via FRED and Yahoo Finance.
This year, the rise in the 10-year yield has almost all come from real yields (the yield after inflation). On the surface, it looks like a growth story. And if you agree with me on the hollowing growth outlook, real yields should start falling, making long bonds a comfortable hedge against further AI jitters. For the record, bonds did work, for about a month, with 10-year yield falling from 5.31% to 4.84%. But now it's back above 5% again, at 5.15% last Friday. Why?
US 10-year yields, daily close, 31 December 2025 to 13 November 2026, change in bps. Source: US Treasury.
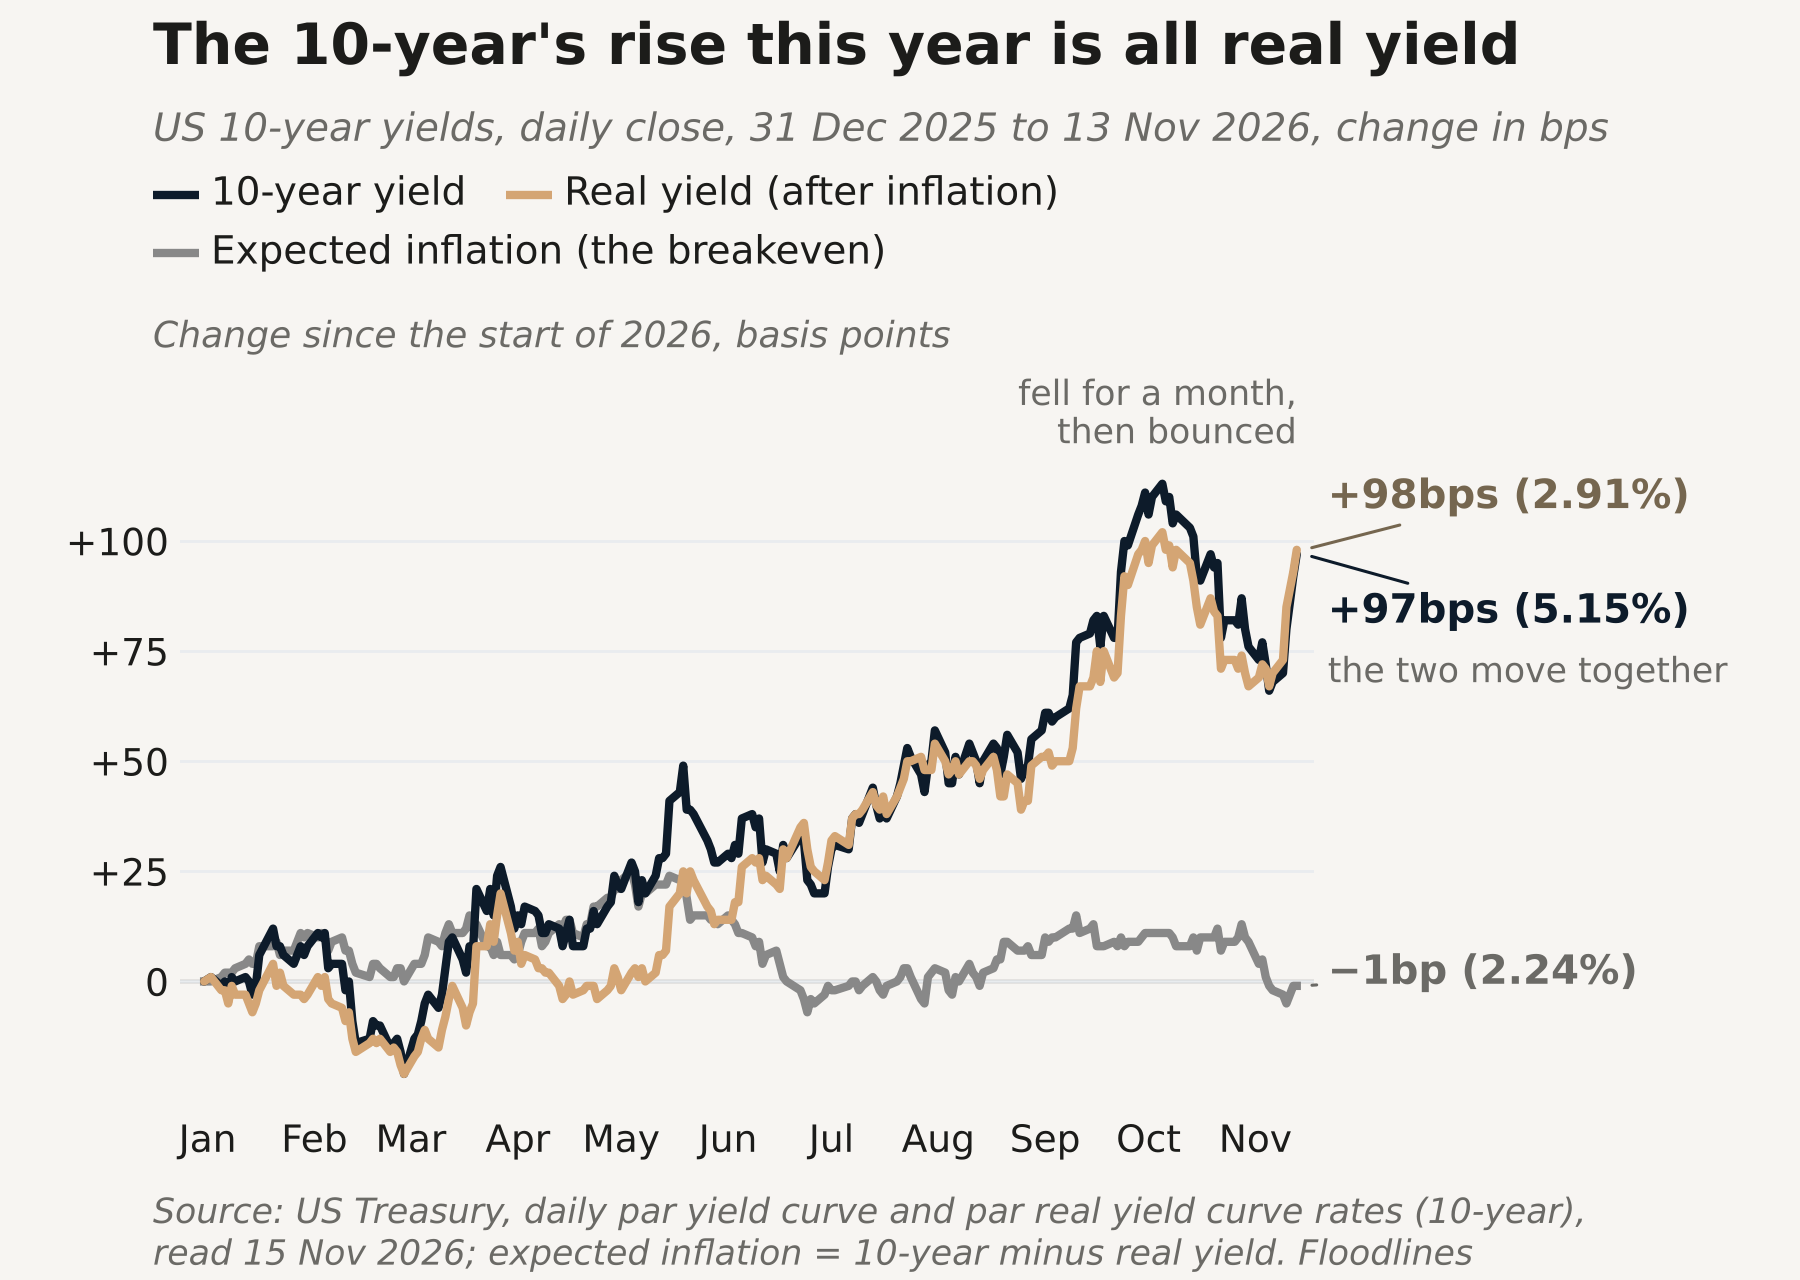
This is because real yields can also climb when markets see bad news ahead, such as interest rates staying elevated for longer. While US Treasuries offered protection from the chip scare at first, they have stopped working as a hedge and are unlikely to cushion bad news on interest rates.
My question: Are you in Treasuries for protection or income?
The anything-but-AI shelter
The third trap is on the flipside of the chip scare. What if AI returns to the throne quicker than markets thought? Can it?
In the ongoing earnings season, most AI companies have been punished despite strong results, as investors look away from the AI trade amid the credit worries around CoreWeave, the Democrats' win of both chambers in the midterms and the leadership upheaval at Nvidia.
US results, 28 September to 13 November 2026: beat or miss, and next-day share move, %. Source: company results; beat or miss calculated by Floodlines against Zacks consensus as shown on Nasdaq.com; Yahoo Finance closes; SEC EDGAR filing times.
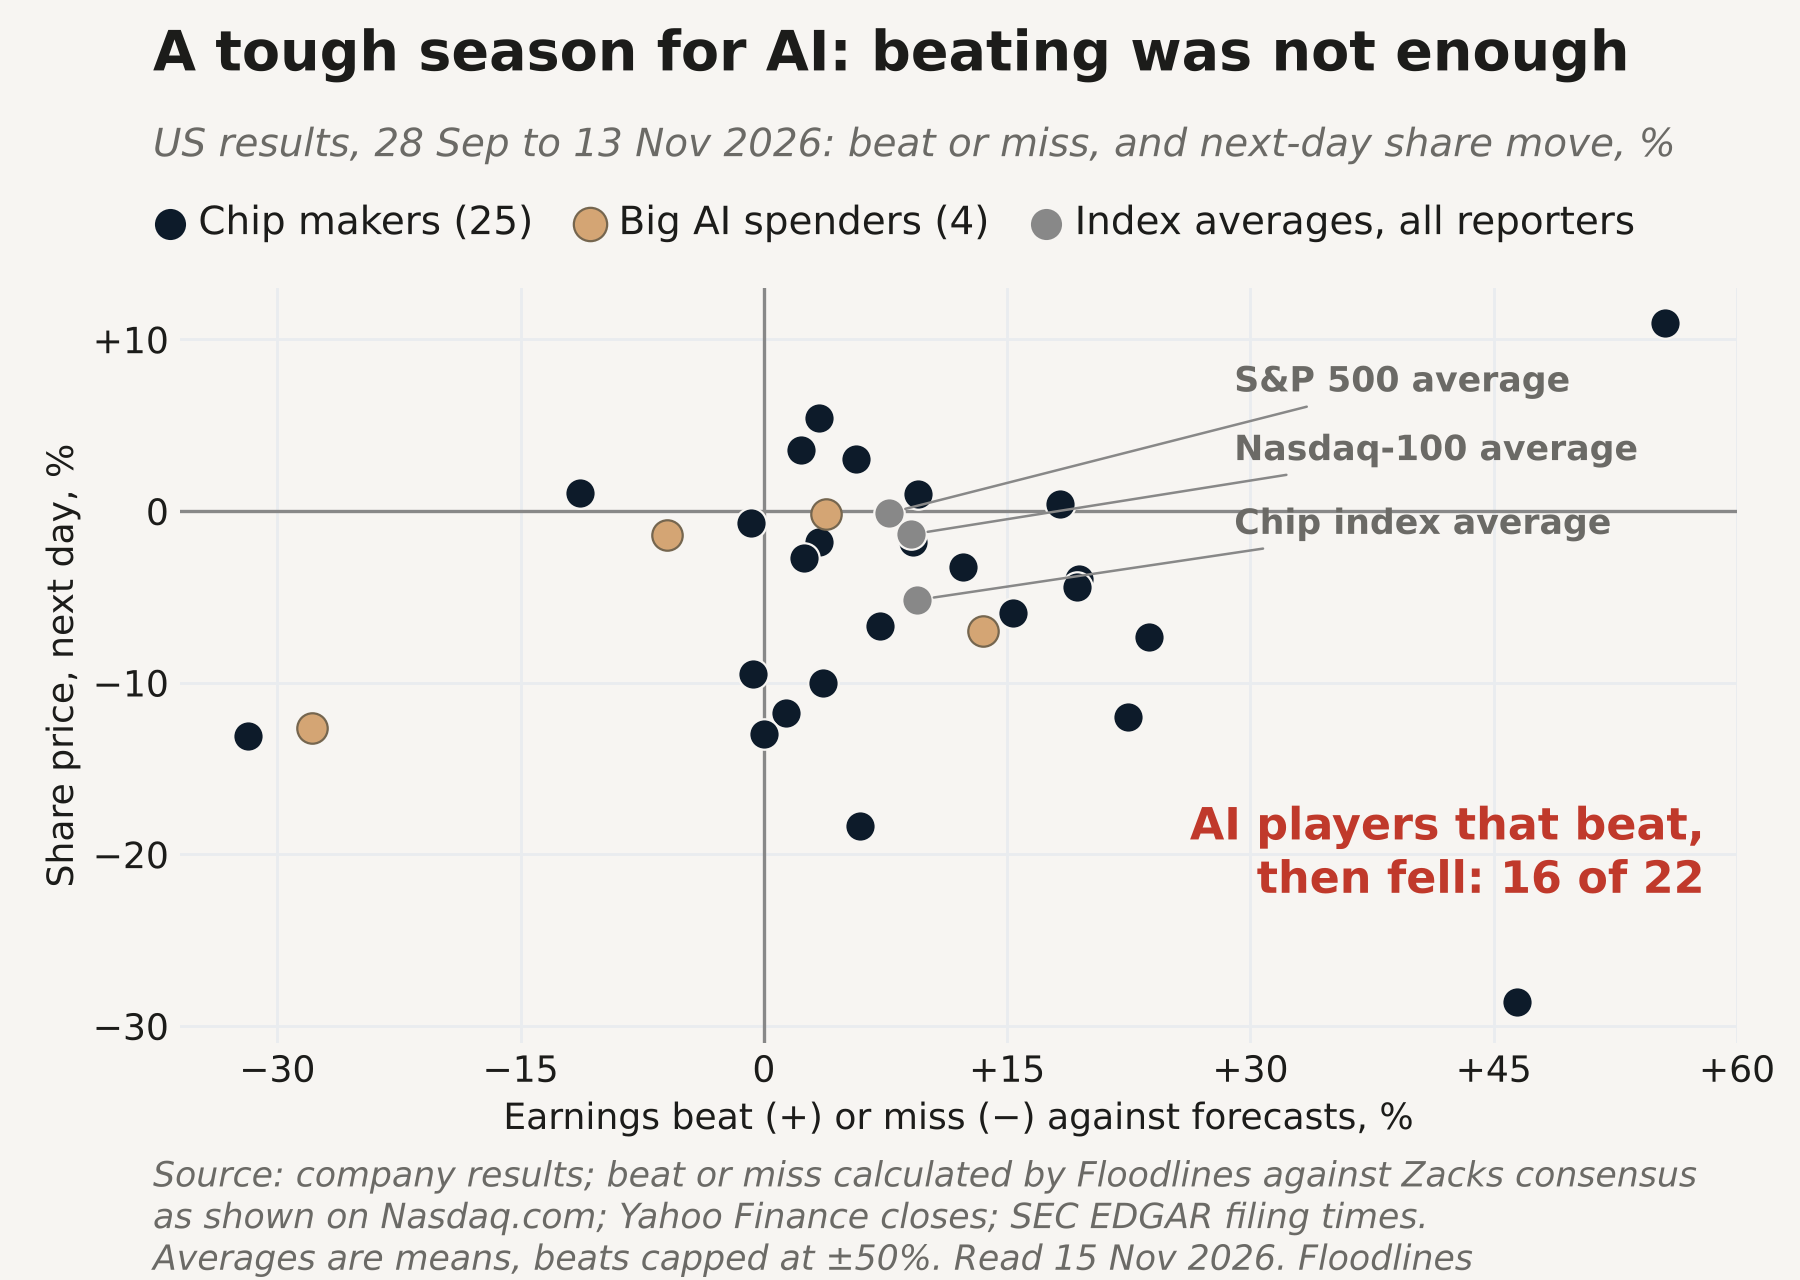
As a result, capital switched to find shelter in anything but US AI. The old economy sectors, such as health care and consumer staples, caught investors' attention again. Similarly, markets with lower AI exposure outperformed, namely Australian large caps and Indian equities, even though both countries still face inflation challenges.
This AI sell-off has been driven by sentiment, not earnings, so far. So the mood needs a clear sign to turn. This week, a strong beat of Nvidia earnings and the reaction to Anthropic's IPO could trigger a relief rally.
Investors now pay 23.7 times next year's expected earnings for consumer staples (FactSet, 13 Nov), on single-digit profit growth, and 18 times for US tech, whose profits grew 69% last quarter. Tech's 18 times is below its October 2022 low of 18.8 (FactSet). If the market comes back to that reality, AI could snap back quickly, and the risk is being caught in old consumer names in a consumption slowdown.
Health care trades at 20 times against a five-year average of 17.4 (FactSet); the ASX 200 about 18, 7% above its ten-year average (Equity Trustees); the Nifty 50 about 17, 18% below (Motilal Oswal, via Business Today).
Sometimes, a comfort zone does not mean security.
My question: Away from AI, sure. But what are you paying for comfort, and what would make it worth it?
The tide
My take on the three questions:
- Do I still believe in it? Half of it. Growth is slowing on the consumer side. I remain confident in the AI build-out over the medium to long term, but near-term headwinds outweigh tailwinds. For my own money, if the Fed ends up hiking aggressively, I will hold back from buying the 'dip'.
- While the Fed keeps hiking, even into slowing growth, Treasuries are unlikely to work as a shelter, in my view. They can still be a source of regular income.
- It's not 2000, not yet. Tech trades at 18 times forward earnings, against 48 in March 2000, and its profits are growing 69% (chips 133%). That backs my point. I find it hard to see a case where AI doesn't come back, though a lasting comeback could take longer than a relief rally. What would change my mind: the big buyers cutting their spending, or their funding drying up first.
This is how I am thinking about it, not advice about what you should do. Don't get comfortable.
General information only, not personal advice. It does not consider your objectives, financial situation or needs; seek advice from a licensed adviser.
The week as a test
| When (Sydney) | What | What it decides |
|---|---|---|
| Tue 17 Nov, 04:00 (Mon 16 Nov, 12:00 US Eastern) | Fed Chair Warsh, opening remarks | Trap two, only if he talks policy (billed as opening remarks) |
| Tue 17 Nov, 11:30 | RBA minutes, 3 Nov meeting (the 6-3 hike) | Trap three: how far Australia's inflation problem runs |
| Wed 18 Nov, 00:30 (Tue 17 Nov, 08:30 US Eastern) | US retail sales (October) | Trap one: does the control group hold once petrol is out? A flat or falling control group is the hollow in a hard print |
| Wed 18 Nov, 01:15 | US industrial production (October) | Trap one: does output follow ISM's 55.5? |
| Wed 18 Nov, after the above (Tue 17 Nov US Eastern, time not posted) | Atlanta Fed GDPNow update | Trap one: does Q4 consumer spending stay under 2.6%? |
| Wed 18 Nov, 08:20 (call 09:00; Tue 17 Nov, 1:20pm US Pacific) | Nvidia results (third quarter, fiscal 2027), the first under interim chief executive Kress | Trap three: can a strong beat lift the AI mood? It also moves tech's 69% profit growth and chips' 133% |
| Wed 18 Nov, 11:30 | Australia Wage Price Index (Q3) | Trap three: real pay in Australia against 4.3% inflation |
| Thu 19 Nov, 06:00 (Wed 18 Nov, 14:00 US Eastern) | FOMC minutes, 27 to 28 Oct | Trap two: how many wanted a hike in October; the rates path behind real yields |
| Thu 19 Nov, 11:30 | Australia Labour Force (October) | Trap three: does Australia's comfort hold (RBA December)? |
| Fri 20 Nov, from 01:30 (US open, Thu 19 Nov) | Anthropic first trade (Nasdaq's expected date; pricing expected Wed 18 Nov evening US Eastern, not confirmed by the company) | Trap three: how the market reacts to the listing |
| Fri 20 Nov, 01:25 (Thu 19 Nov, 09:25 US Eastern) | Fed Vice Chair Jefferson, "Economic Shocks" | Trap two |
| Sat 21 Nov, 04:15 (Fri 20 Nov, 12:15 US Eastern) | Fed Governor Cook, "The U.S. Economy in Global Context"; she voted for a hike on 28 Oct | Trap two: a hawk's read on December |
| Just beyond: Wed 25 Nov, 11:30 | Australia CPI (October) | Trap three: "inflation challenges" for Australia |
| Just beyond: Thu 26 Nov, 00:30 | US GDP, Q3 second estimate | Trap one: does 3.4% hold? |
SourcesShow all 31Hide
- Nvidia share price: Nasdaq.com, historical quotes, closes of 6, 9 and 10 November 2026, read 15 November 2026.
- Nvidia: "NVIDIA Announces CEO Transition", 12 November 2026.
- Nvidia: corporate timeline (founded 5 April 1993).
- The scandal: Reuters, 8 November 2026, as published by Khaleej Times, reporting that Nvidia's then chief executive told staff he had been unfaithful to his wife; read 16 November 2026.
- GDP: US Bureau of Economic Analysis, Gross Domestic Product, Third Quarter 2026 (Advance Estimate), 29 October 2026; NIPA Tables 1.1.1, 1.1.2 and 1.5.2.
- ISM: Manufacturing PMI Report On Business, October 2026, released 2 November 2026 (via PR Newswire).
- Retail sales: US Census Bureau, Advance Monthly Retail Trade, September 2026, 15 October 2026.
- Data centre votes: Ballotpedia News, "Voters favored limiting data center development in 40 of 41 local ballot measures on Nov. 3", 6 November 2026.
- Data centre moratoriums: National Conference of State Legislatures, "Why States Are Considering Temporary Bans on New Data Centers", 2026.
- Data centre moratoriums: Bisnow, "14 States, Dozens of Localities Consider Data Center Bans", 14 June 2026.
- Consumer spending estimate: Federal Reserve Bank of Atlanta, GDPNow, fourth-quarter 2026 estimate, 9 November 2026 (a model estimate, not an official figure).
- Real pay: US Bureau of Labor Statistics, Real Earnings, October 2026, 10 November 2026.
- Unemployment expectations: Federal Reserve Bank of New York, Survey of Consumer Expectations, October 2026, 9 November 2026.
- Saving: US Bureau of Economic Analysis, Personal Income and Outlays, September 2026 (personal saving rate, via FRED, PSAVERT), 29 October 2026.
- Chart 1: BEA, NIPA Tables 1.1.1 and 1.1.2, Q4 2024 to Q3 2026 (advance estimate, 29 October 2026); Atlanta Fed GDPNow, 9 November 2026 (model estimate). Links as above.
- Floodlines, Tidelines, "Trick or treat? Mostly tricks", 26 October 2026.
- Chart 2: Board of Governors of the Federal Reserve System, Selected Interest Rates (H.15), 10-year Treasury constant maturity, via FRED (DGS10); federal funds target rate, via FRED (DFEDTAR, DFEDTARU); S&P 500, S&P Dow Jones Indices, via FRED (SP500, 2016 on) and Yahoo Finance (1994); read 15 November 2026. Largest fall is the peak-to-trough fall in daily closes from the close before the Fed's turning move to the 10-year's peak close; Floodlines calculation.
- Chart 3: US Department of the Treasury, Daily Treasury Par Yield Curve Rates and Daily Treasury Par Real Yield Curve Rates, 2026, read 15 November 2026; expected inflation = 10-year yield minus real yield (Floodlines calculation).
- Chart 4: company results; beat or miss calculated by Floodlines against Zacks consensus as shown on Nasdaq.com; daily closes from Yahoo Finance; report timing from SEC EDGAR filing times; read 15 November 2026. Floodlines calculation.
- Sector funds, indices and exchange rates: Yahoo Finance closes for the Health Care, Consumer Staples and Technology Select Sector SPDR funds, the S&P 500, the S&P/ASX 200 (S&P Dow Jones Indices), the Nifty 50 (NSE Indices), AUD/USD and USD/INR, 6 October to 13 November 2026, read 15 November 2026.
- India inflation: Ministry of Statistics and Programme Implementation (NSO), Press Release of Consumer Price Index on Base 2024=100 for October 2026, 12 November 2026.
- Australia inflation: Australian Bureau of Statistics, Consumer Price Index, Australia, September 2026, 28 October 2026.
- Australia rates: Reserve Bank of Australia, Statement by the Monetary Policy Board: Monetary Policy Decision, 3 November 2026.
- India rates: Reserve Bank of India, monetary policy framework (target 4%, band 2% to 6%).
- Anthropic listing: Nasdaq, IPO calendar, read 15 November 2026; timing as expected, not confirmed by the company.
- Valuations and profit growth: FactSet, Earnings Insight, 13 November 2026 (S&P 500 information technology sector, forward 12-month P/E, 18.0 on prices to 12 November; consumer staples 23.7; blended third-quarter profit growth 69.4% for the sector, 133% for semiconductors and semiconductor equipment).
- Tech's October 2022 low: FactSet, Earnings Insight, 14 October 2022 (S&P 500 information technology sector, forward 12-month P/E, 18.8).
- Tech's March 2000 multiple: Yardeni Research, S&P 500 Information Technology forward P/E, week of 14 March 2000 (48), against FactSet's 18.0 for 13 November 2026, both the S&P 500 information technology sector, 12-month forward.
- Valuations (health care, Australia, India): FactSet Earnings Insight, 13 November 2026 (S&P 500 and sectors, prices to 12 November); Equity Trustees, Monthly Summary, October 2026 (S&P/ASX 200); Motilal Oswal Private Wealth via Business Today, 5 November 2026 (Nifty 50).
- The week as a test: release calendars of the Federal Reserve, the RBA, the US Census Bureau, the Australian Bureau of Statistics and the BEA; Nvidia's newsroom; the Atlanta Fed's GDPNow page; times are Sydney (AEDT).
- Cover: Floodlines (illustration).
Currency: share moves are price only (no dividends), in US dollars for US companies. Yields are in percent; changes are in basis points (bps), with 100bps equal to one percentage point. Valuations are forward price-to-earnings multiples (price divided by the next 12 months' expected profit).
Company, index and benchmark names are trade marks of their owners and are used only to identify the companies, indices and benchmarks concerned. That includes the S&P 500 index and S&P/ASX 200 (S&P Dow Jones Indices; ASX is a trade mark of ASX Operations Pty Limited), the Nasdaq-100 Index and PHLX Semiconductor Sector Index (Nasdaq, Inc.), the Nifty 50 (NSE Indices Limited), the ISM Manufacturing index (Institute for Supply Management) and GDPNow (Federal Reserve Bank of Atlanta). No company, index owner, benchmark administrator or data publisher named here sponsors or endorses Floodlines.
Important information
Show full termsHide full terms
Important. Floodlines publishes independent research and commentary on the economy, markets, industries and supply chains. It is general information only. Floodlines is not licensed to provide financial product advice and does not provide it. Nothing here is a recommendation to buy, hold or sell any financial product. Nothing here has been prepared by reference to any reader’s objectives, financial situation or needs, and Floodlines does not respond to individual questions about personal circumstances, holdings or portfolios. Views are the author’s own as at the date of publication, may change without notice, and may be wrong. Where a piece says how sure the author is of a view, or what would change her mind, that describes her confidence in her own reading of events. It is not an instruction to any reader. Where the author says what she is doing, or is comfortable doing, with her own money, that describes her own decision in her own circumstances. It is not a recommendation that any reader do the same. Before making any financial decision, obtain advice from a licensed financial adviser and consider the relevant product disclosure statement or offer document. Where a piece reports the author’s past calls, it is a record of her own process, wrong calls included. Past calls are not an indicator of future performance.
Disclosure. Floodlines pays to use Anthropic's Claude in its research; no other relationship with Anthropic or its underwriters. I hold no Anthropic shares and haven't applied in the IPO.
Interests. No company in this piece is discussed as an investment. Nvidia is named for its change of chief executive, share move and results; CoreWeave for reported credit worries; Anthropic for its listing, as a market event; chart 4 names no company. The author holds no position in Nvidia, CoreWeave, Anthropic or any company on chart 4 (shares, bonds, options or other securities, directly or through an account she directs) and has not applied for Anthropic shares. She holds no US Treasuries, government bond, money market or cash fund; no technology, semiconductor, AI, Nasdaq-100 or broad index fund; no consumer staples or health care fund; no fund tracking Australian or Indian shares; no SOX or US interest-rate futures or options. Floodlines pays Anthropic for Claude and receives nothing else from it, or from any issuer, index owner, underwriter or dealer. Other names are sources of news and data only.
United States readers. Floodlines is a publication of general and regular circulation. It provides impersonal commentary only, does not provide personalised investment advice, does not hold itself out as an investment adviser, and is not registered as an investment adviser with the SEC or any state. Floodlines will not answer questions about your portfolio or circumstances. Floodlines receives no compensation from any issuer, underwriter or dealer in respect of any security discussed.