
- Awkward good news: a strong jobs report last Friday gave investors long-awaited good news, and a breather from the market 'blues'. However, it is an awkward one, as it could push the Fed to more rate hikes. But hiking into an already fear-choked economy could risk a policy mistake. Hiking does not make oil cheaper or chips arrive sooner.
- The chip blues ripple across the Pacific: the midterm blue sweep exacerbated last week's chip sell-off, but still mostly through mood, not fundamentals. Tech-heavy Asian markets were caught in the gloom, with Korea, Taiwan and Japan hit hard.
- Money goes to anything but US AI: investors 'broke up' with the US AI trade and ran to anything as far away from it as possible, including Hong Kong tech, Indian equities and American malls. Understandable, and it may work for a while, until something decisively lifts the mood in AI. We are watching Nvidia's report and Anthropic's IPO anxiously.
Awkward good news
Like Miles Davis's album, markets are feeling kind of blue. Last week I said that this time bad news might actually be bad news. After the midterm sell-off, that mattered more than ever. Friday's strong payrolls spared us that test. It is good news, but awkward good news, because it could add to rate rises. The Fed's Mary Daly said on record: "My expectation is we're going to have to tighten policy further." Futures price close to two more hikes by June 2027, and a December hike at about three in four.
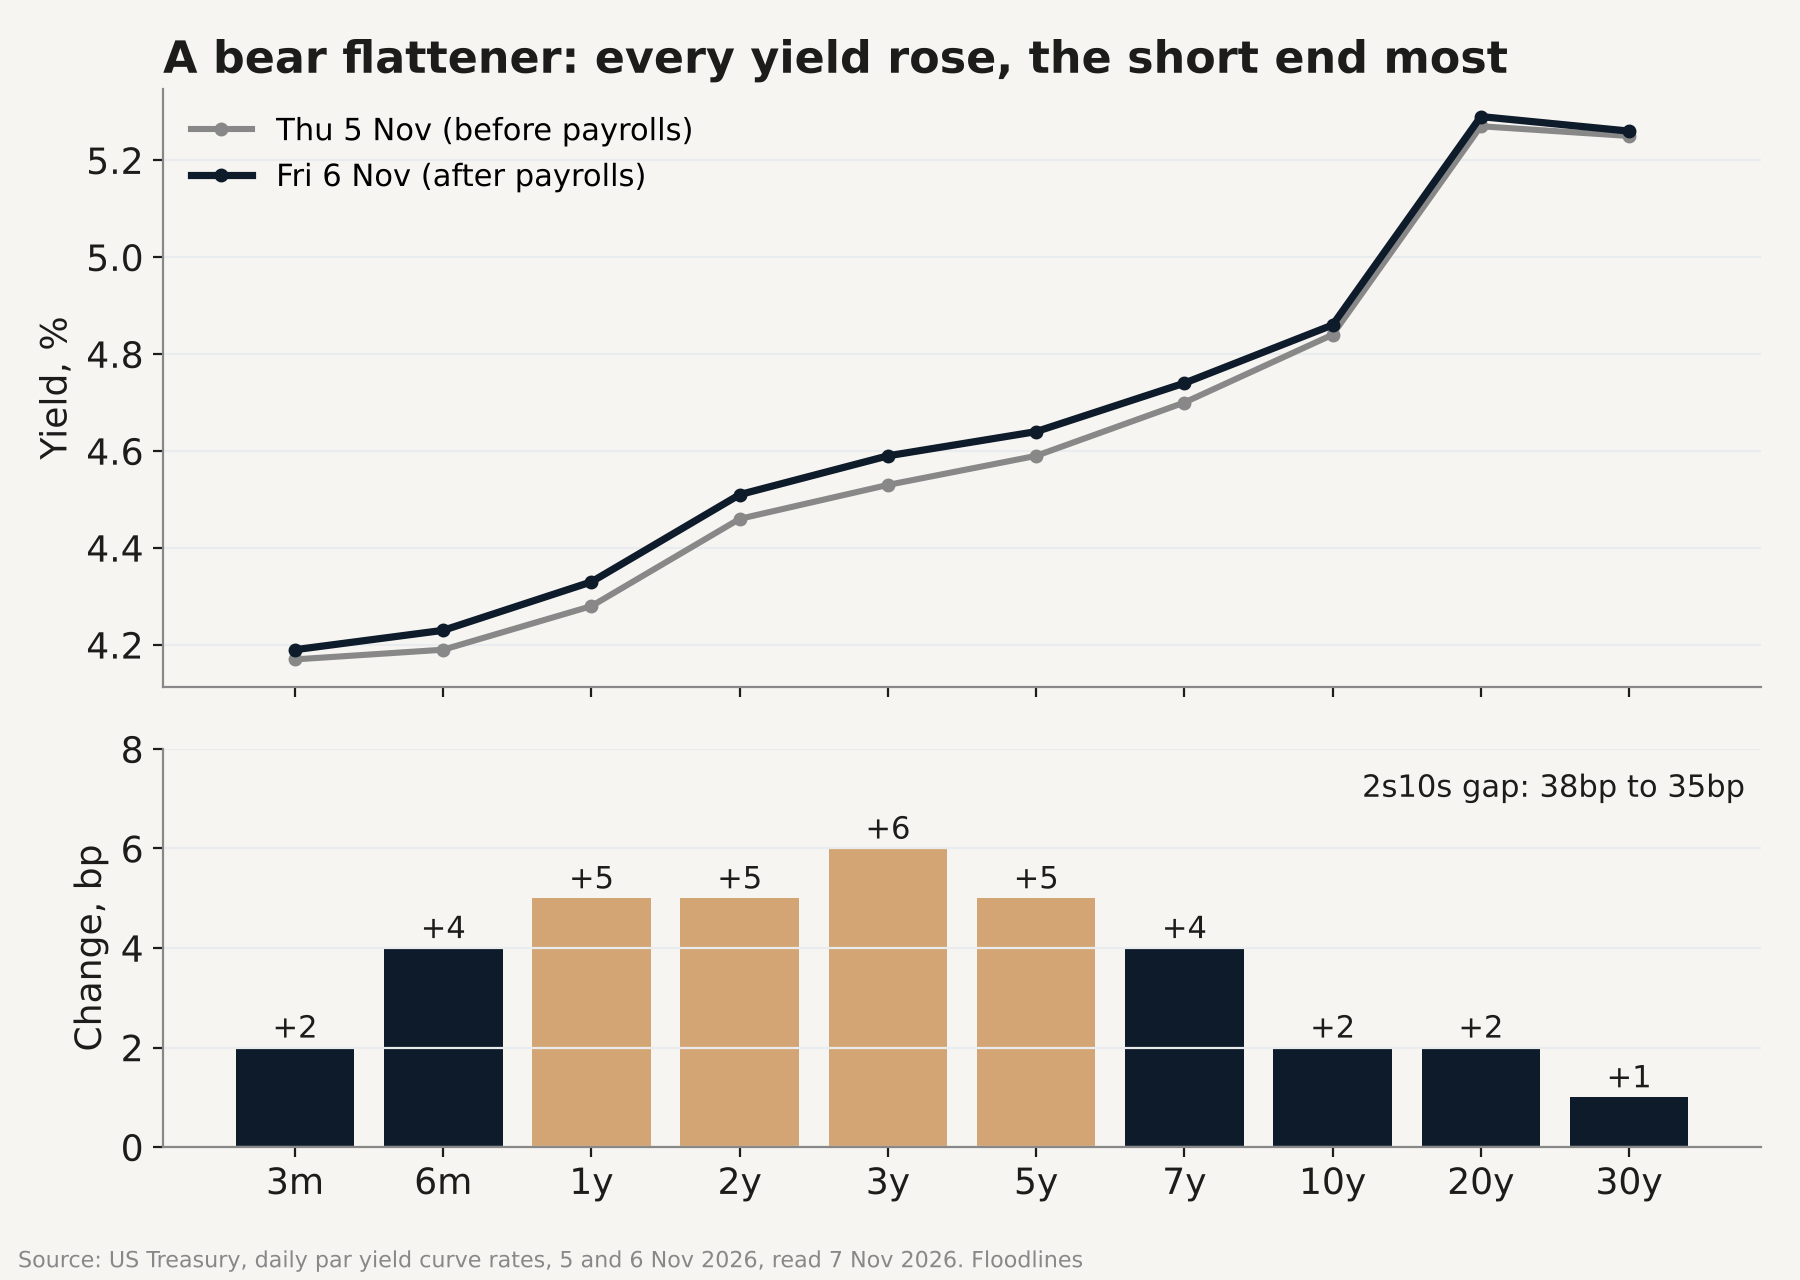
The consequence shows up in bonds. After Friday's payrolls report, bond yields rose across the curve, with short-term yields climbing more. If inflation expectations start to tick up, it could pressure bonds further, and investors could be one haven short.
US Treasury par yields, Thursday 5 and Friday 6 November 2026, percent; change in basis points. Source: US Treasury.
Zoom in on the US growth picture, and investors could see support for the bond market's move as well. While GDP grew at 3.4% in Q3 and October's ISM Manufacturing Index stayed above 50, at 55.5, about a third of that strength is waiting on parts. Prices are still rising, driven by metals, tariffs and oil, and mostly squeezed by supply rather than pulled by demand. In short, growth is not that rosy. I read it as businesses stocking up while they can, before the US-China truce runs out and while the US-Iran war seems to be taking a break, rather than a 2021-style boom.
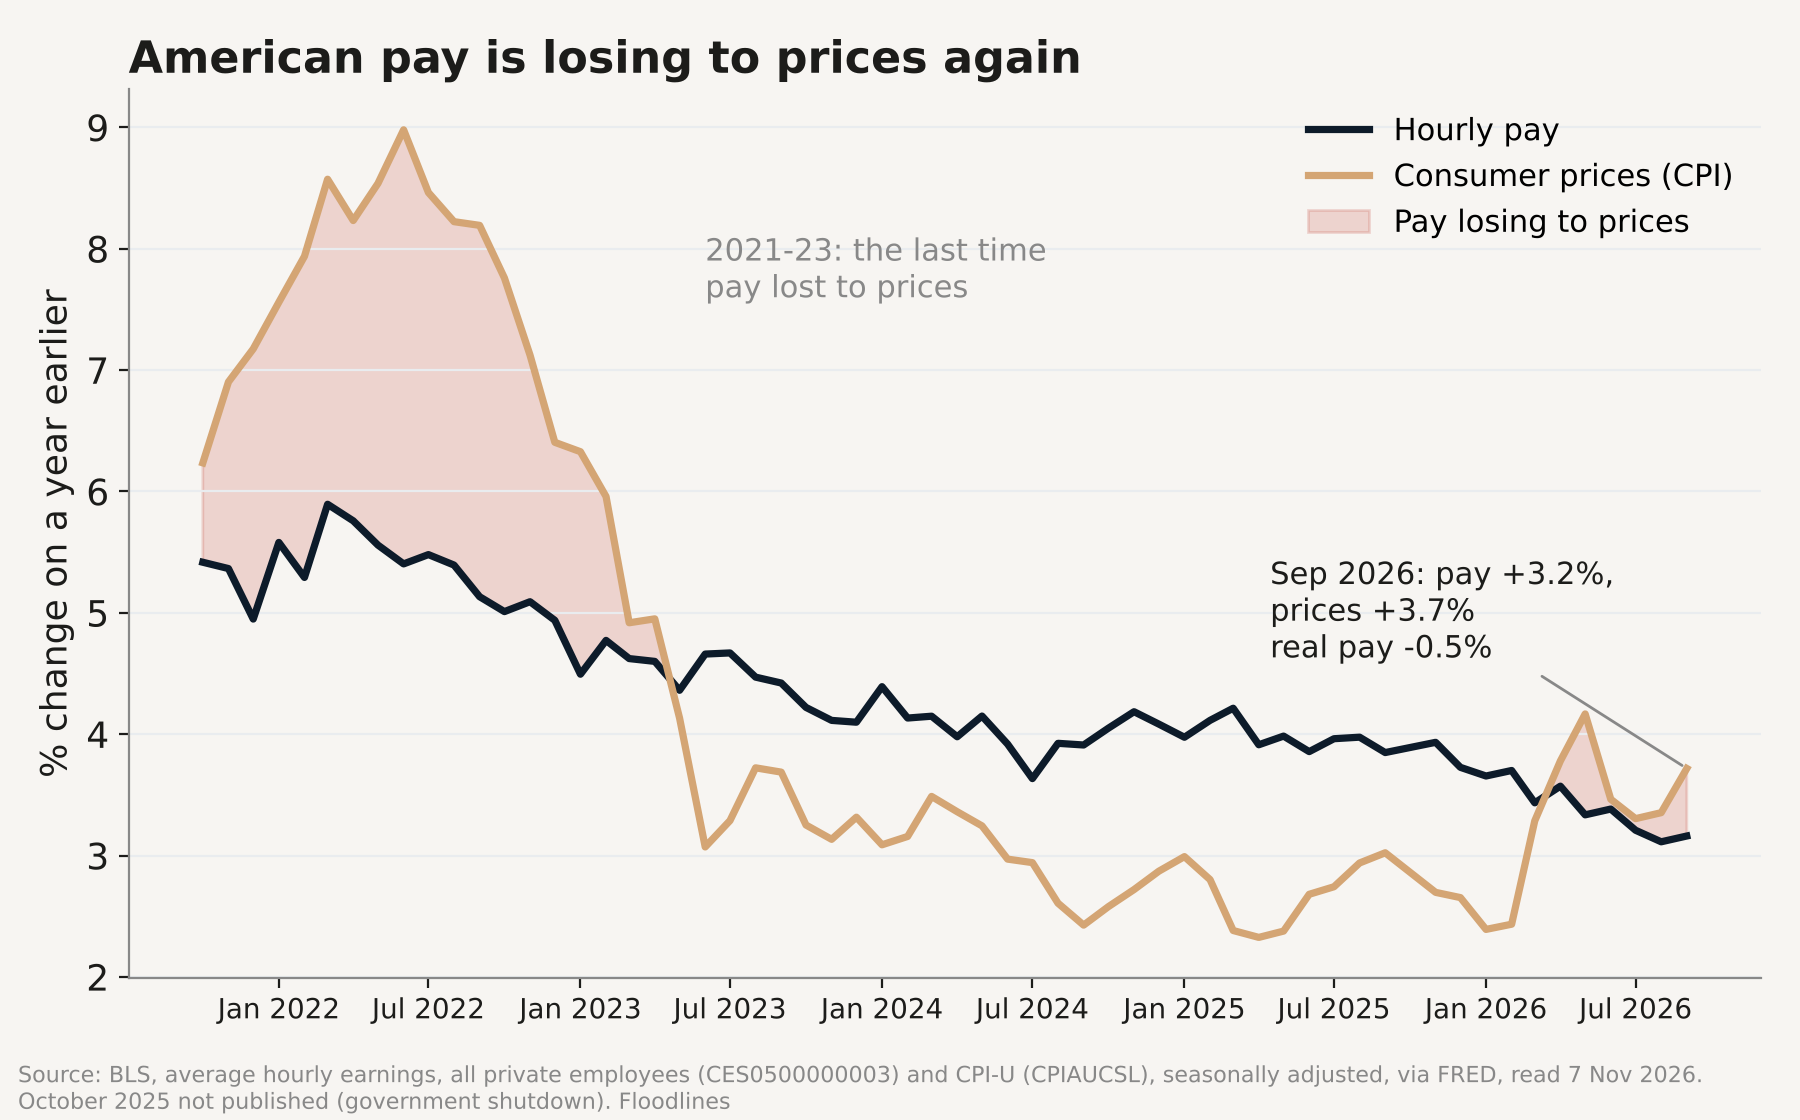
Meanwhile, affordability is falling. American hourly pay rose 3.2% in the year to September, under the 3.7% growth in prices. The reality behind the tight labour market is that real pay is shrinking. And when was the last time? 2021 to 2023, a stretch that began a year before the Fed started one of the most aggressive hiking cycles in decades.
Average hourly earnings, all private employees, and the consumer price index, change on a year earlier, percent, October 2021 to September 2026. Source: BLS via FRED.
One important distinction is that in 2022 the Fed got to hike from zero in a strong growth environment, with households sitting on Covid savings. Today, rates are already 3.75 to 4%, almost 4 percentage points higher than then. And the Fed is potentially hiking into a nervous market, with households' real pay shrinking and their savings cushion thinning. This is where I ponder whether aggressive hikes could be a policy mistake, as hiking does not make oil cheaper or chips arrive sooner.
My reading: This awkward good news gave equities a breather from the midterm blue storm, but did not clear it at all. Strong jobs push the Fed towards more hikes, but growth is not that rosy and real pay is shrinking. Hiking into a market already choked by fear could be a policy mistake.
The chip blues ripple across the Pacific
Driven by inflation and AI bubble fear, the chip sell-off started in the US but spilled quickly to Asia from October, as Asia's chipmakers are the key suppliers of the chips and memory that power AI data centres. Last week, the Democrats' dominance in Congress added insult to injury, with the US chip index down 11%, and the KOSPI and Nikkei down 10% and 9% respectively since the election.
Equity markets, price return in US dollars, 31 December 2025 to 6 November 2026, percent. Source: index closes and exchange rates, Yahoo Finance.
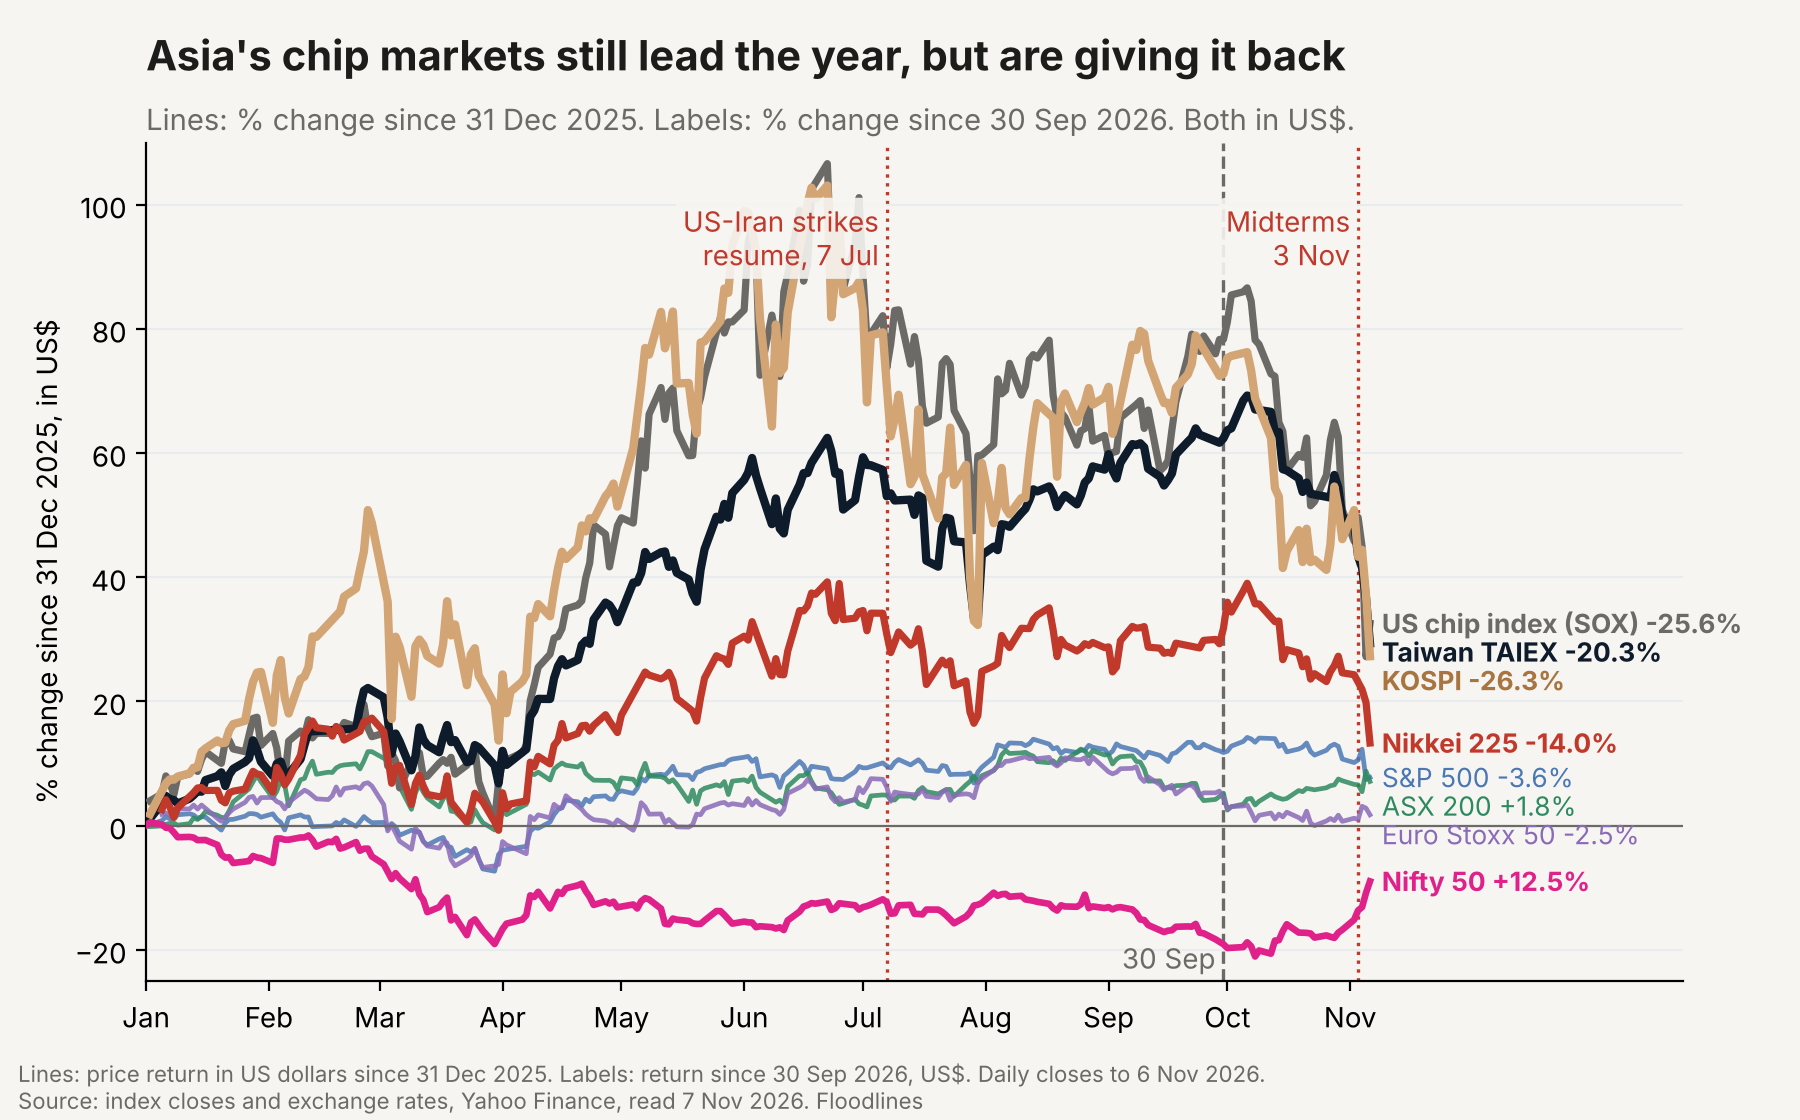
In my view, this sell-off remains sentiment-driven, as fundamentals and demand are still holding up. Korea's chip exports grew 259% year on year in October, to a record US$56.4bn. SK hynix says demand for its memory chips will outrun supply until 2030. No US hyperscaler has dialled back its capex budget, and most of them still sit on large cash piles. Mood swings generally have an end date; we just cannot time it precisely. From a policy-setting standpoint, Trump still has his veto, and on election night he warned Democrats that if they did not work with him, "I'd just veto everything."
The chip sell-off affected Australia as well, and its impact is unlikely to be short-term. On the surface, the ASX 200 rose 3.3% over the past month, but its materials sector fell 6.7%. Most of that fall was iron ore and China, led by BHP, Rio Tinto and Fortescue; but the copper and lithium miners fell hardest, 15 to 26%. This is because copper, through the AI build-out, has become an "AI metal" in investors' eyes. A demand panic in chips punishes metals directly.
My reading: As sentiment turned against the US AI build-out, the chip blues spread to tech-heavy Asian markets like Korea, Taiwan and Japan. This sell-off is driven by fear but lacks fundamental evidence. Australia is affected too, through what's under the ground: AI metals such as copper.
Money goes to anything but US AI
Amid the recent chip sell-off, investors rushed as far as possible from US AI: into Indian equities, which had been sold off all year and have almost no AI exposure; into cheap Chinese tech, the rival bet to the US AI build-out; and into real estate, not data centres but shopping malls and healthcare property. Over the week, India's Nifty 50 rose 9.4% and Hong Kong's Hang Seng 5.2% in US dollars; US mall and healthcare property trusts rose 4 to 5%, while data-centre landlords fell.
Over the next couple of weeks, with the US-Iran push and pull, a potential US-China trade renegotiation and the December rate decision, investors should not expect clarity. Until something clearly lifts AI sentiment, for example Anthropic's IPO, the waves of capital in and out of the US AI trade could last longer.
US sectors, S&P 500, Nifty 50 and Hang Seng: change over the week (30 Oct to 6 Nov) and since the election (3 to 6 Nov), percent, in US dollars. Source: Yahoo Finance.
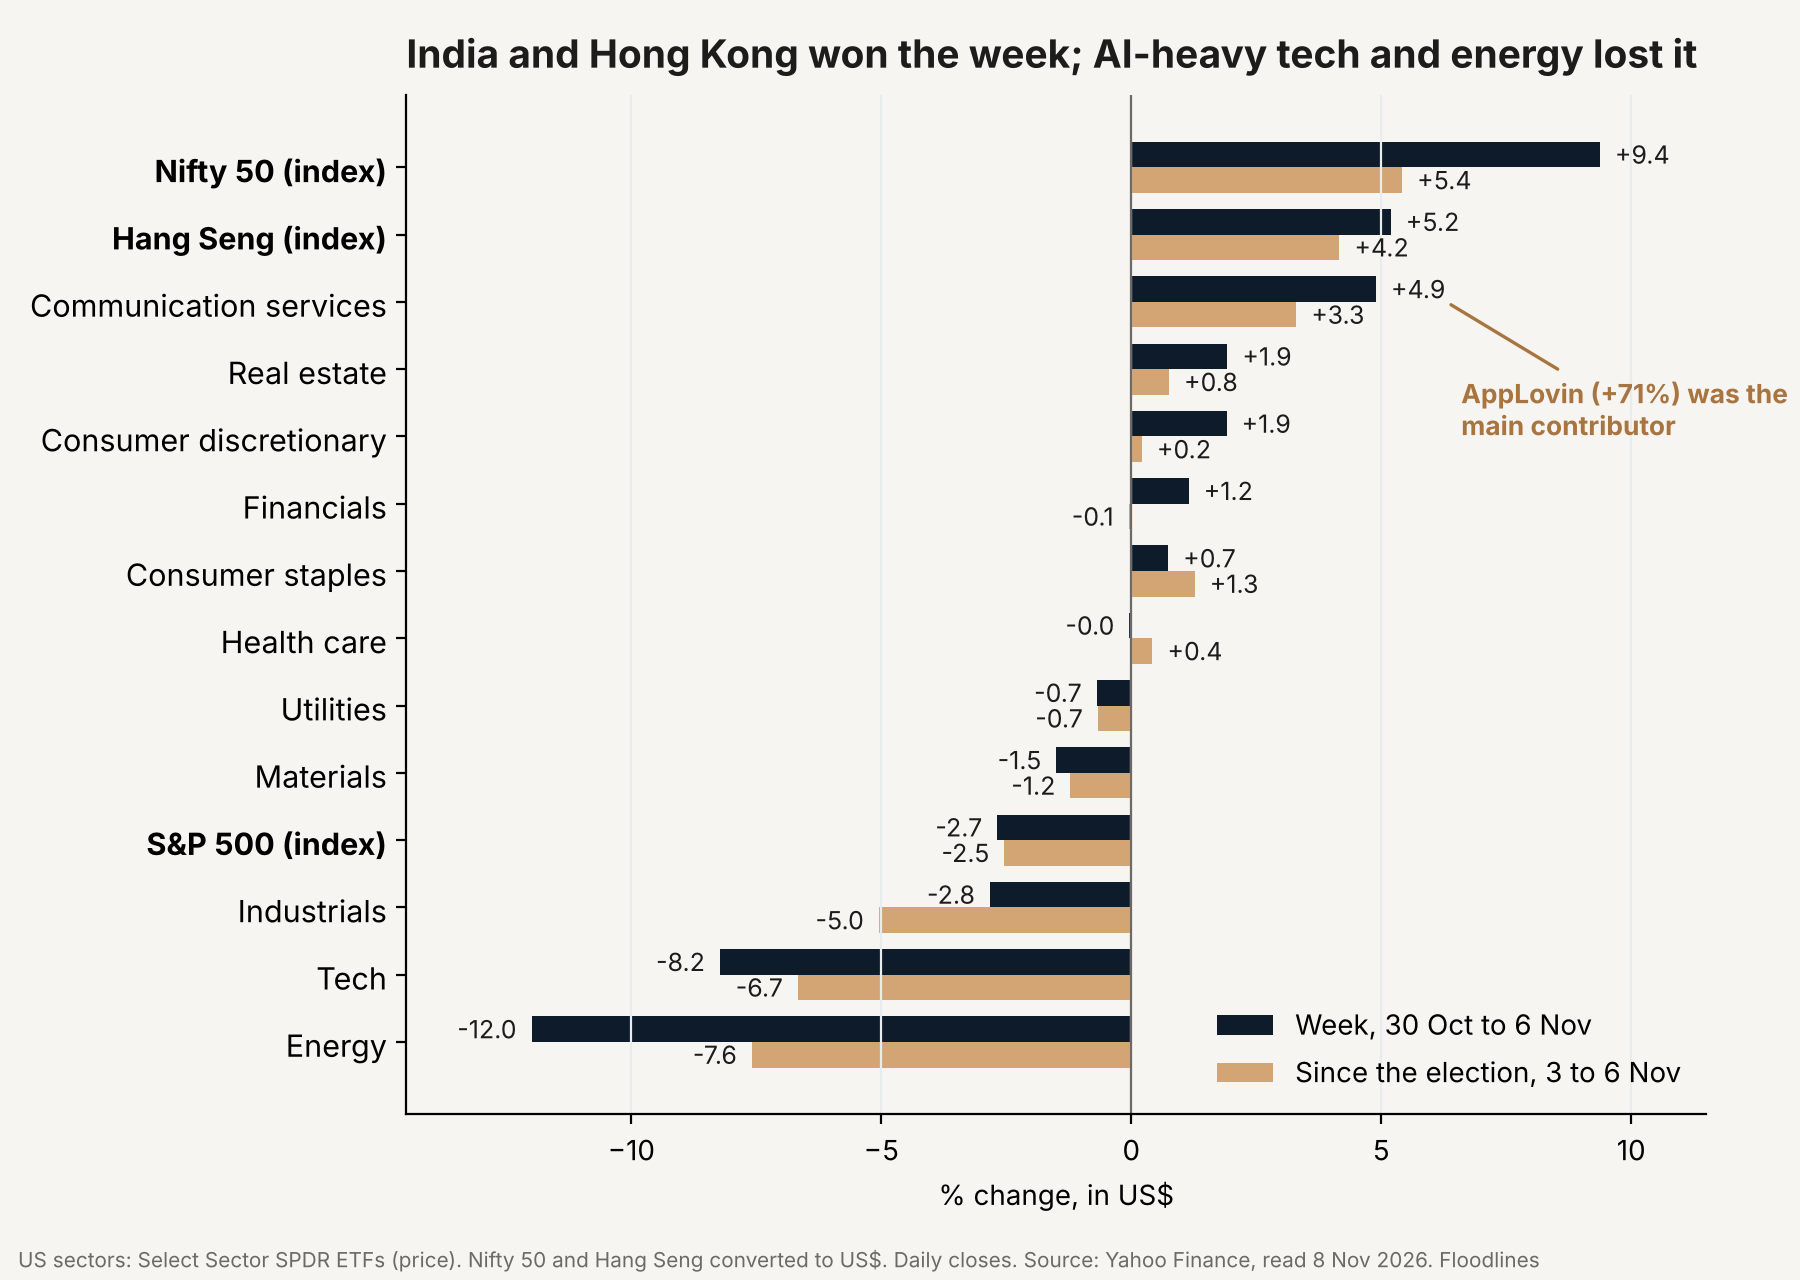
Interestingly, the standout exception has been communication services, which gained 4.9%, largely driven by AppLovin's strong results (revenue grew 55% year on year), clear proof of AI profitability. The stock, at about 6% sector weight, rose more than 70% in a week, telling investors that strong AI adopters with profits can still get rewarded.
My reading: Investors took a break from 'dating' AI and went back to "safer" options: shopping malls and healthcare property in the US, cheap Chinese tech in Hong Kong, and Indian equities, which had been sold off all year. Yes, we all know AI is still the headline act, but until something lifts the mood, we are probably stuck in volatility for a while. Nvidia reports on 17 November (US time), and Anthropic's IPO could come before Thanksgiving (26 November); let's hope they are good ones.
The tide
November started with the market, and the White House, feeling kind of blue. What worries me is that monetary policy, Congress and market mood are all turning against AI, the main engine of growth so far. Hiking into an economy where real pay is shrinking and growth isn't that rosy risks a policy mistake. I hold my view that the AI trade could return as investors realise the current sell-off was largely mood-driven: Trump has his veto against a blue Congress, and corporate fundamentals remain resilient. But it needs a kick, a clear event that reignites AI sentiment. I'm watching Anthropic's IPO and Nvidia's earnings for that kick, or another drag. Until then, expect the cliché: volatility. I'm comfortable spreading some capital away from US AI while I look for entry points.
The week as a test
| When (Sydney) | What | What it decides |
|---|---|---|
| Tue 10 Nov | US-China truce deadline | Washington has said it will extend the truce to 10 January: is the extension made official, or does the fight restart? |
| Wed 11 Nov, 00:30 | US CPI (October) | Does inflation lock in a December hike? |
| Mid to late Nov (reported) | Anthropic IPO | Can a listing lift the AI mood? Date not confirmed |
| Wed 18 Nov, about 08:20 | Nvidia results | Can earnings lift the AI mood? |
| Sat 5 Dec, 00:30 | US payrolls (November) | Is the good news still awkward? |
| Thu 10 Dec, 06:00 | Fed decision | A hike into fear, or a pause? |
SourcesShow all 19Hide
- Payrolls, revisions, unemployment, average hourly earnings: US Bureau of Labor Statistics, Employment Situation, October 2026, released 6 November 2026.
- Mary Daly: CNBC interview, 6 November 2026. Fed target range 3.75 to 4%: Federal Reserve, held 28 October 2026; effective fed funds rate, New York Fed.
- Hikes priced: 30-day fed funds futures, closes of 6 November 2026, against the effective fed funds rate (about 1.8 hikes by June 2027; December about three in four); Floodlines calculation, checked against CME FedWatch.
- Chart 1: US Treasury daily par yield curve, 5 and 6 November 2026.
- GDP: US Bureau of Economic Analysis, third quarter 2026 advance estimate (+3.4% annualised), 29 October 2026.
- ISM: ISM Manufacturing PMI, October 2026, released 2 November 2026. Share of the index's strength from slower supplier deliveries: (59.1 - 50) / 5 = 1.82 of the 5.5 points above 50; Floodlines calculation. 2021 and 2022 comparisons: ISM reports of the time.
- Chart 3: average hourly earnings, all private employees (CES0500000003), and CPI-U (CPIAUCSL), seasonally adjusted, BLS via FRED, read 7 November 2026.
- Chart 2 and index moves: index closes and exchange rates, Yahoo Finance, read 7 and 8 November 2026; price returns in US dollars; Floodlines calculation. Since the election: from the 3 November close (Nikkei from 2 November; Tokyo was closed on 3 November).
- Korea October exports: Ministry of Trade, Industry and Energy, 1 November 2026, via Korea Times.
- SK hynix: third-quarter 2026 results release, 28 October 2026.
- Hyperscaler capex and cash: company results releases for the third quarter of 2026 (e.g. Alphabet, Amazon).
- Trump on the veto: CBS, 3 November 2026, as quoted by Fox News, 4 November 2026.
- Australia: S&P/ASX 200 and S&P/ASX 200 Materials closes, 6 October to 6 November 2026 (A$), and miners' share prices (copper and lithium miners -14.6% to -25.7%), Yahoo Finance; Floodlines calculation.
- Chart 4 and the week's moves: US Select Sector SPDR funds (price), S&P 500, Nifty 50 and Hang Seng (in US$), and US property trusts, daily closes 30 October to 6 November 2026, Yahoo Finance; Floodlines calculation. AppLovin: third-quarter 2026 results, 8-K, 4 November 2026.
- India: flows and index moves, Indian press reports and Yahoo Finance, 6 November 2026.
- Nvidia results date: NVIDIA, 28 October 2026. Anthropic listing: amended registration statement (S-1/A); timing as reported, not confirmed.
- US-China truce: CNBC, 24 September 2026; Federal Register, 26 October 2026.
- The week as a test: release calendars of the BLS and the Federal Reserve; times are Sydney (AEDT).
- Cover: Floodlines (illustration).
Currency: index and sector changes are in US dollars, converted at market exchange rates, price only (no dividends), unless marked as local currency (A$ for the Australian sector moves). Yields are in percent; changes in percentage points.
Company, index and benchmark names are trade marks of their owners and are used only to identify the companies, indices and benchmarks concerned. That includes the PHLX Semiconductor Sector Index (Nasdaq, Inc.), the KOSPI (Korea Exchange), the TAIEX (Taiwan Stock Exchange), the Nikkei 225 (Nikkei Inc.), the S&P 500 and S&P/ASX 200 indices (S&P Dow Jones Indices; ASX is a trade mark of ASX Operations Pty Limited), the EURO STOXX 50 (STOXX Ltd.), the Nifty 50 (NSE Indices Limited), the Hang Seng Index (Hang Seng Indexes Company Limited), the CSI 300 (China Securities Index Co., Ltd.), the Select Sector SPDR funds (SPDR is a trade mark of Standard & Poor's Financial Services LLC), the ISM Manufacturing index (Institute for Supply Management) and fed funds futures (CBOT, part of CME Group). No company, index owner, benchmark administrator or data publisher named here sponsors or endorses Floodlines.
Show full termsHide full terms
Important. Floodlines publishes independent research and commentary on the economy, markets, industries and supply chains. It is general information only. Floodlines is not licensed to provide financial product advice and does not provide it. Nothing here is a recommendation to buy, hold or sell any financial product. Nothing here has been prepared by reference to any reader’s objectives, financial situation or needs, and Floodlines does not respond to individual questions about personal circumstances, holdings or portfolios. Views are the author’s own as at the date of publication, may change without notice, and may be wrong. Where a piece says how sure the author is of a view, or what would change her mind, that describes her confidence in her own reading of events. It is not an instruction to any reader. Where the author says what she is doing, or is comfortable doing, with her own money, that describes her own decision in her own circumstances. It is not a recommendation that any reader do the same. Before making any financial decision, obtain advice from a licensed financial adviser and consider the relevant product disclosure statement or offer document. Where a piece reports the author’s past calls, it is a record of her own process, wrong calls included. Past calls are not an indicator of future performance.
Interests. No company in this piece is discussed as an investment. AppLovin is named for its results and the market's reaction to them; SK hynix only for its own statement on demand; BHP, Rio Tinto and Fortescue only as leaders of a sector's fall; Nvidia only for the date of its results; Anthropic only for its reported share listing, as a possible market event. The author holds no position in any of these companies (shares, bonds, options or other securities, directly or through an account she directs) and has not applied for shares in Anthropic's listing. She holds no technology, semiconductor, AI, Nasdaq-100 or broad market index fund; no fund that tracks Indian, Hong Kong, Chinese, Korean, Taiwanese or Japanese shares; no Select Sector SPDR fund; no real estate investment trust or property fund; no mining or materials fund; no options or futures on the PHLX Semiconductor Sector Index; no US Treasuries or US government bond funds (long or short); and no US interest-rate futures or options. Floodlines pays Anthropic for its Claude AI service, which it uses in preparing its research, and receives nothing else from Anthropic. Other companies and officials appear only as sources of news and data. The indices, sector funds, government bond yields, the ISM index and fed funds futures are used only as measures of markets. Floodlines receives no payment from any issuer, index owner, underwriter or dealer in connection with anything discussed.
United States readers. Floodlines is a publication of general and regular circulation. It provides impersonal commentary only, does not provide personalised investment advice, does not hold itself out as an investment adviser, and is not registered as an investment adviser with the SEC or any state. Floodlines will not answer questions about your portfolio or circumstances. Floodlines receives no compensation from any issuer, underwriter or dealer in respect of any security discussed.